





USDJPY Drops to 150, EURUSD Holds Ahead of Flash PMIs
USDJPY retested the 150 zone for the first time since December 2024, alongside a rise in 10-year government bond yields to 16-year highs. Meanwhile, EURUSD remains above 1.04 ahead of upcoming Flash PMI releases.
Share this:

Key Events:
- FOMC minutes confirm rate hold expectations and ongoing inflation concerns
- USDJPY drops to December 2024 lows as Japanese 10Y government bond yields surge to 16-year highs
- EURUSD holds above 1.04 ahead of key economic data
- Upcoming Events: Flash PMI indicators for Japan, the Eurozone, the UK, and the US
USDJPY Drops to December 2024 Lows
Following its peak in January 2025 at 158.88, USDJPY has retreated nearly 800 points, as the Yen regains momentum with support from the Bank of Japan (BOJ) and broader economic stability. The US Dollar Index is currently holding above the 106 level, reflecting market indecision amid Trump tariff risks, inflation concerns, and expectations of a Federal Reserve rate hold.
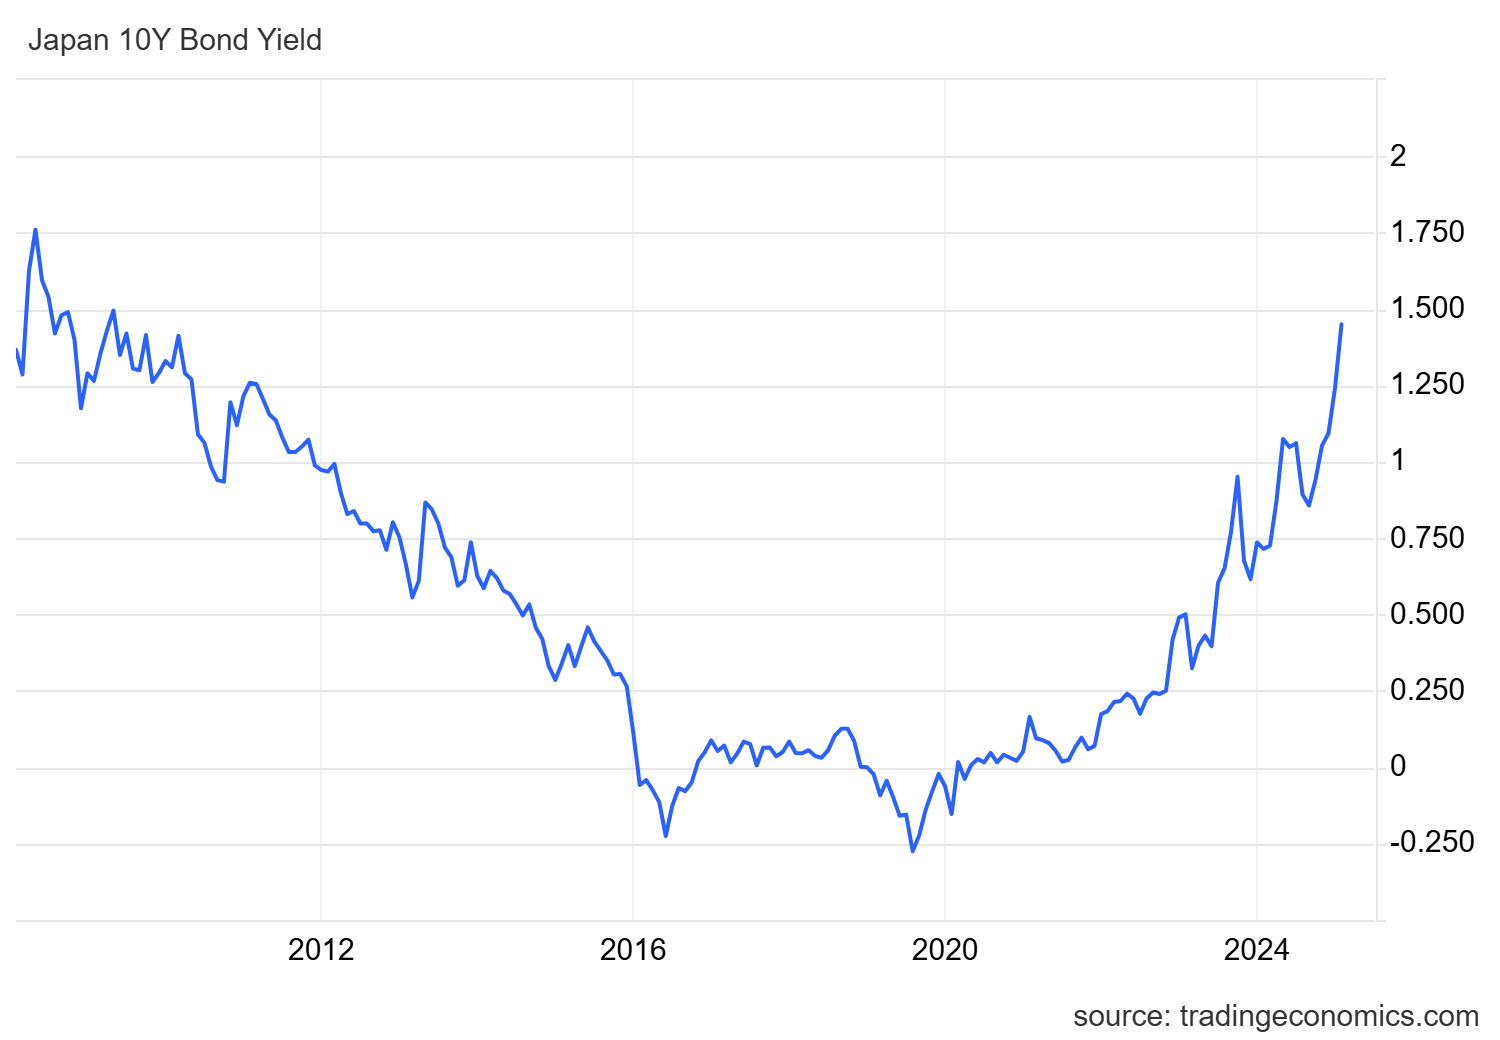
On the other hand, the Japanese Yen is showing stronger confidence as BOJ rate hike expectations grow. The 10-year Japanese government bond yield has hit its highest level since 2009, aligning with economic forecasts and the outlook for gradual rate hikes.
Source: Trading Economics
EURUSD Holds Above 1.04 Ahead of Flash PMIs
The Flash Manufacturing and Services PMI indicators, scheduled for release on Friday, are keeping EURUSD steady above 1.04. These indicators often trigger significant market volatility, particularly for a pair struggling to break above 1.0520 and continue the uptrend established from its January 2025 low. Uncertainty around Trump administration policies, inflation concerns, and broader economic risks is limiting further upside potential for EURUSD. However, positive growth indicators could reinforce the current trend.
Technical Analysis: Quantifying Uncertainties
USDJPY Forecast: 3-Day Time Frame – Log Scale
Source: TradingView
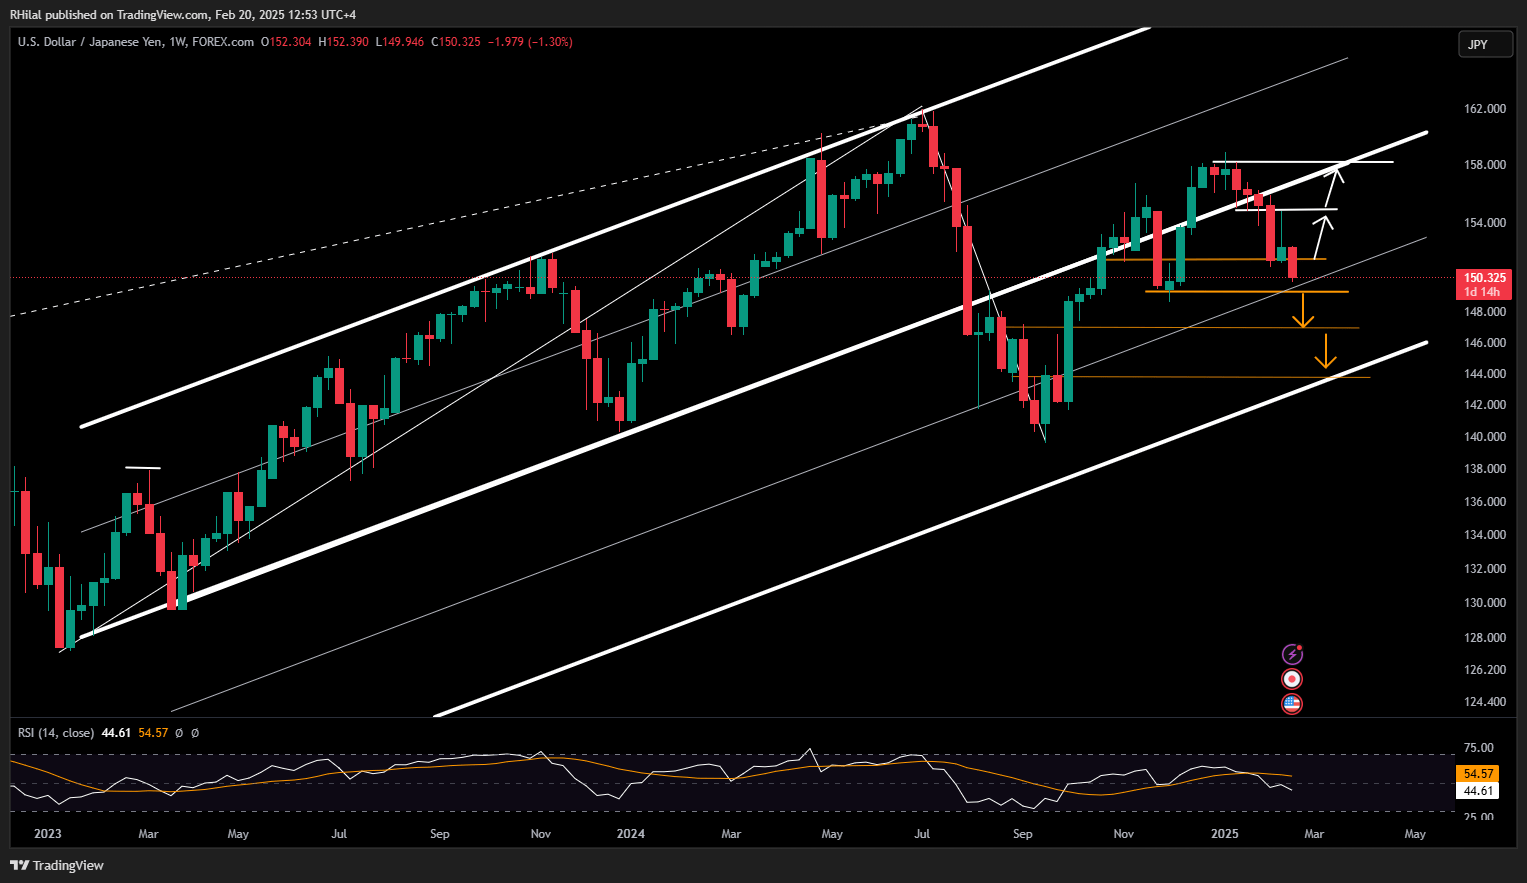
USDJPY has dropped to 150, retesting December 2024 lows, as 10-year Japanese government bond yields reach 16-year highs amid BOJ rate hike optimism.
- The 149.50 level serves as a key support, aligning with the midpoint of a long-respected price channel that has guided USDJPY movements between 2023 and 2025.
- A clear close below 149.50 could extend the drop toward 147, aligning with the 0.618 Fibonacci retracement level of the uptrend from September 2024 (139.58) to January 2025 (158.88).
- The next major support level aligns with the 0.786 Fibonacci retracement, the lower channel boundary, and 143.60.
EURUSD Forecast: 3-Day Time Frame – Log Scale
Source: TradingView
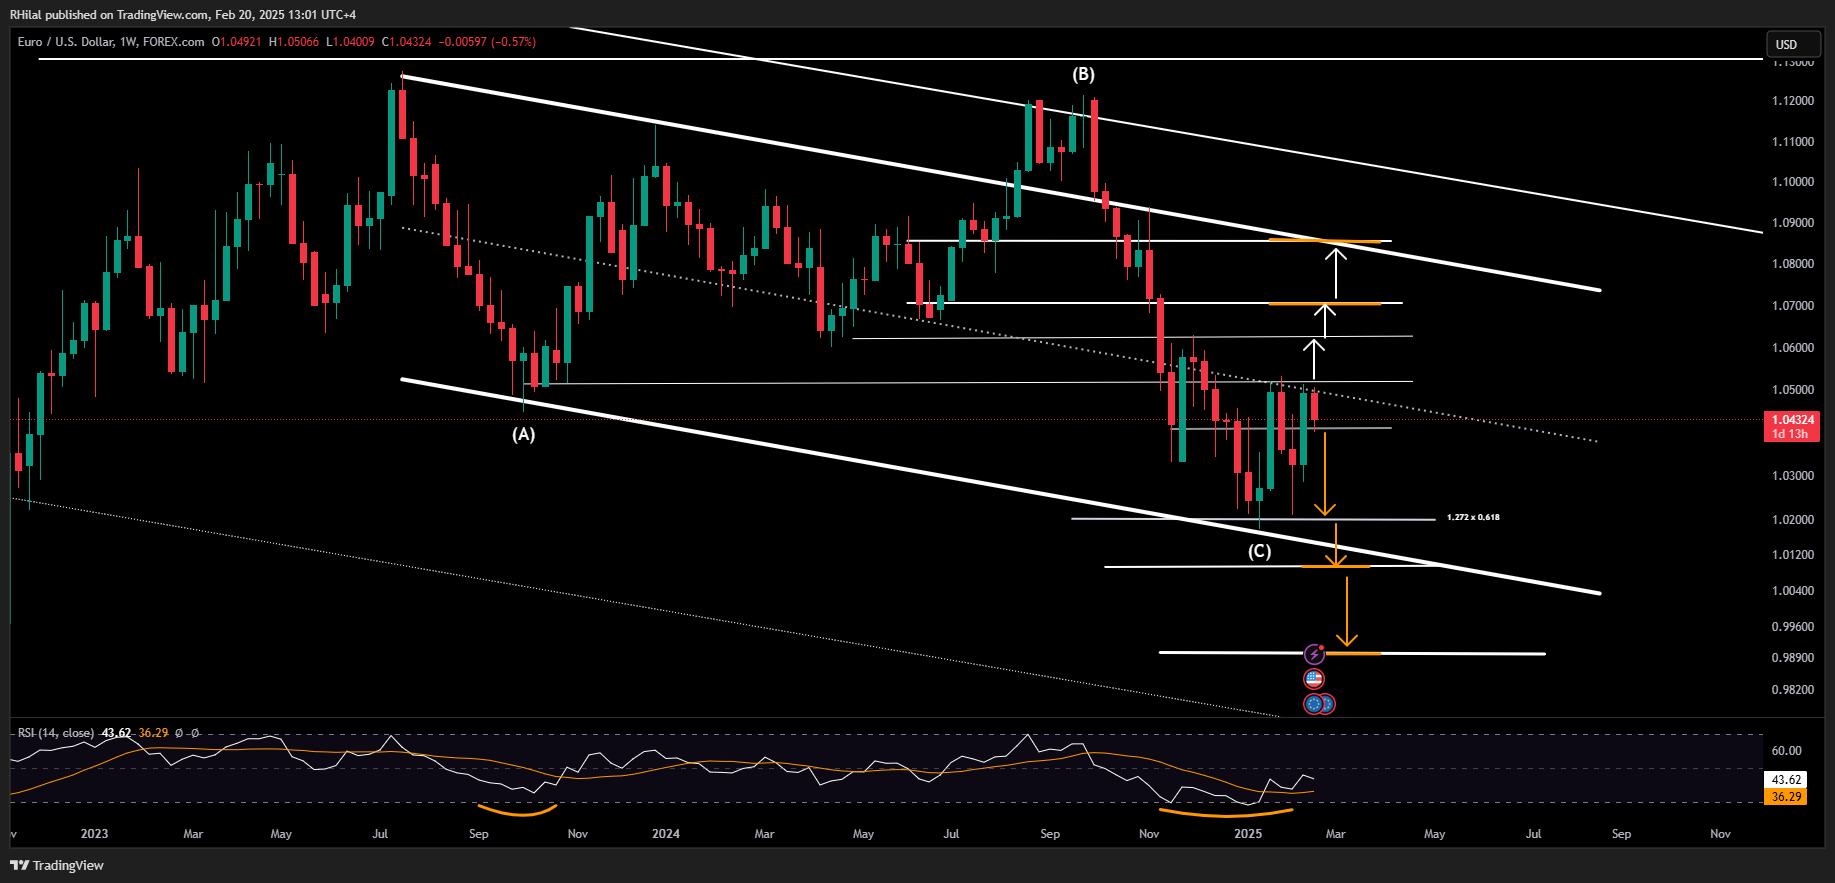
EURUSD remains below the mid-channel zone and the 1.0520 resistance level. Market indecision is evident, particularly given the US Dollar Index’s current stance. A clean close above 1.0520 could trigger rallies toward 1.0620, 1.07, and 1.0850, aligning with the upper channel boundary (established between July 2023 and February 2025). On the downside, a break below 1.0330 could prompt a deeper retracement toward 1.02, and in extreme cases, 1.0170, parity (1.0000), or even 0.99.
Written by Razan Hilal, CMT
Follow on X: @Rh_waves
You Tube: Commodities and Forex Trading with Razan Hilal
Related tags:

Open an account in minutes
Experience award-winning platforms with fast and secure execution.
Economic calendar
Web Trader platform
Our sophisticated web-based platform is packed with features.
Related articles

NZD/USD Forecast: Kiwi faces historic breakdown as RBNZ survey looms
NZD/USD is teetering above support that held through the pandemic and Liberation Day turmoil. With RBNZ hawks repeatedly disappointed, today's inflation expectations survey could open the door to a slide towards the GFC lows.

USD/JPY, AUD/JPY: Central Bank Divergence Creates Two-Way Risk
USD/JPY eyes a breakout above 160, while AUD/JPY faces further losses as Fed, RBA and BoJ interest rate expectations diverge.


DXY, GBP/USD, AUD/USD, USD/CAD, USD/JPY, Gold Weekly Technical Outlook 11 16 2026
Sr. Technical Strategist Michael Boutros highlights the levels that matter on the USD Majors, commodities, and equity indices charts this week.

StoneX Financial Ltd (trading as "FOREX.com") is an execution-only service provider. This material, whether or not it states any opinions, is for general information purposes only and it does not take into account your personal circumstances or objectives. This material has been prepared using the thoughts and opinions of the author and these may change. However, FOREX.com does not plan to provide further updates to any material once published and it is not under any obligation to keep this material up to date.
This material is short term in nature and may only relate to facts and circumstances existing at a specific time or day. Nothing in this material is (or should be considered to be) financial, investment, legal, tax or other advice and no reliance should be placed on it. No opinion given in this material constitutes a recommendation by FOREX.com or the author that any particular investment, security, transaction or investment strategy is suitable for any specific person.
The material has not been prepared in accordance with legal requirements designed to promote the independence of investment research. Although FOREX.com is not specifically prevented from dealing before providing this material, FOREX.com does not seek to take advantage of the material prior to its dissemination. This material is not intended for distribution to, or use by, any person in any country or jurisdiction where such distribution or use would be contrary to local law or regulation. For further details see our full non-independent research disclaimer and quarterly summary.