The ASX 200 heads into Jackson Hole with historical patterns pointing to higher volatility once the Australian market reopens on Monday. Sector correlations also highlight where leadership is strongest, while nearby support and resistance levels could shape the next directional move.
View related analysis:
- Jackson Hole FX Returns: Volatility Analysis for USD Dollar, FX Majors
- FX Futures Positioning: USD Falls, CAD Strengthens, JPY Shorts Return | COT Report
- US Dollar Bounce Looks Vulnerable, EUR/USD Respects Resistance for Now
- Australian Dollar Outlook: AUD/USD Faces Inflation, Fed and Jackson Hole
- Nasdaq 100 Outlook: Thanksgiving Seasonality and Volatility Trends
With the annual Jackson Hole symposium approaching, I wanted to look at how the ASX 200 has performed around the event. Given the highlight is the Fed Chair’s speech, we will look at ASX 200 performance over the three trading days either side of it, as well as on the day itself.
As the Fed Chair usually speaks on Friday lunchtime in Europe — around midnight in Australia — we can assume T-3 is Tuesday, T-2 is Wednesday and so on.
You can also see how FX majors have performed around the event in yesterday’s Jackson Hole preview. The main takeaway was that Friday tends to be the most volatile session for FX, although directional returns were not robust.
Source: ASX, LSEG
ASX 200 Returns Show Little Directional Edge
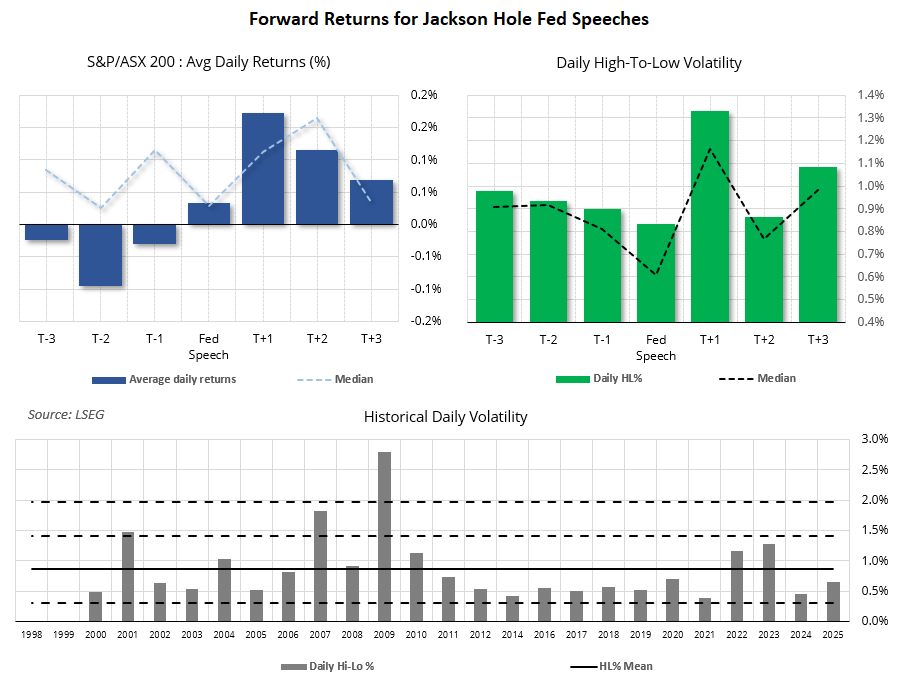
The ASX 200 has to wait until Monday to react to the Fed Chair’s speech, so the cash market tends to see its highest volatility on T+1. In contrast, the Friday cash session ahead of the speech is typically the least volatile.
T+1 also has the strongest average return at 0.17%, while the median return peaks at 0.16% on T+2. Neither is compelling enough for me to assume Monday is likely to deliver gains. The divergence between average and median returns also suggests the directional data is not particularly robust.
Source: ASX, LSEG
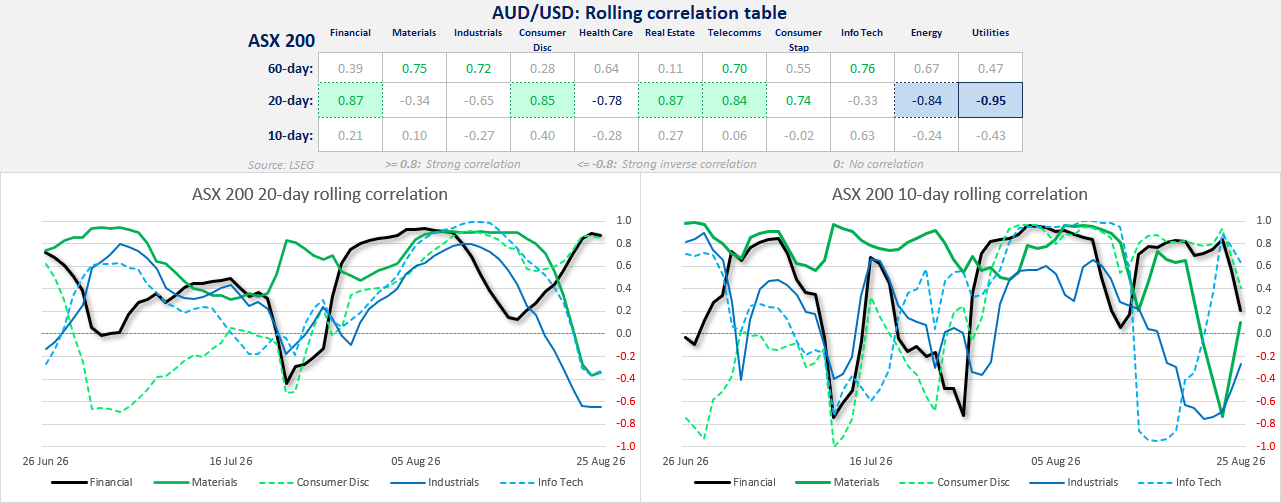
- 20-day correlations are the standout: Financials (+0.87), Consumer Discretionary (+0.85), Real Estate (+0.87) and Telecoms (+0.84) are moving closely with the ASX 200.
- Utilities (-0.95) and Energy (-0.84) show the strongest inverse relationships over 20 days, with Healthcare also notably negative (-0.78).
- 60-day leadership is broader: Materials (+0.75), Industrials (+0.72), Telecoms (+0.70) and Info Tech (+0.76) remain positively aligned with the index.
- 10-day correlations are weak overall, suggesting recent sector leadership is less reliable and more fragmented.
- Trader takeaway: Financials remain the cleanest short-term proxy for ASX 200 direction, while Utilities and Energy are behaving as relative hedges.
ASX 200 Cash Market: Options Level Analysis
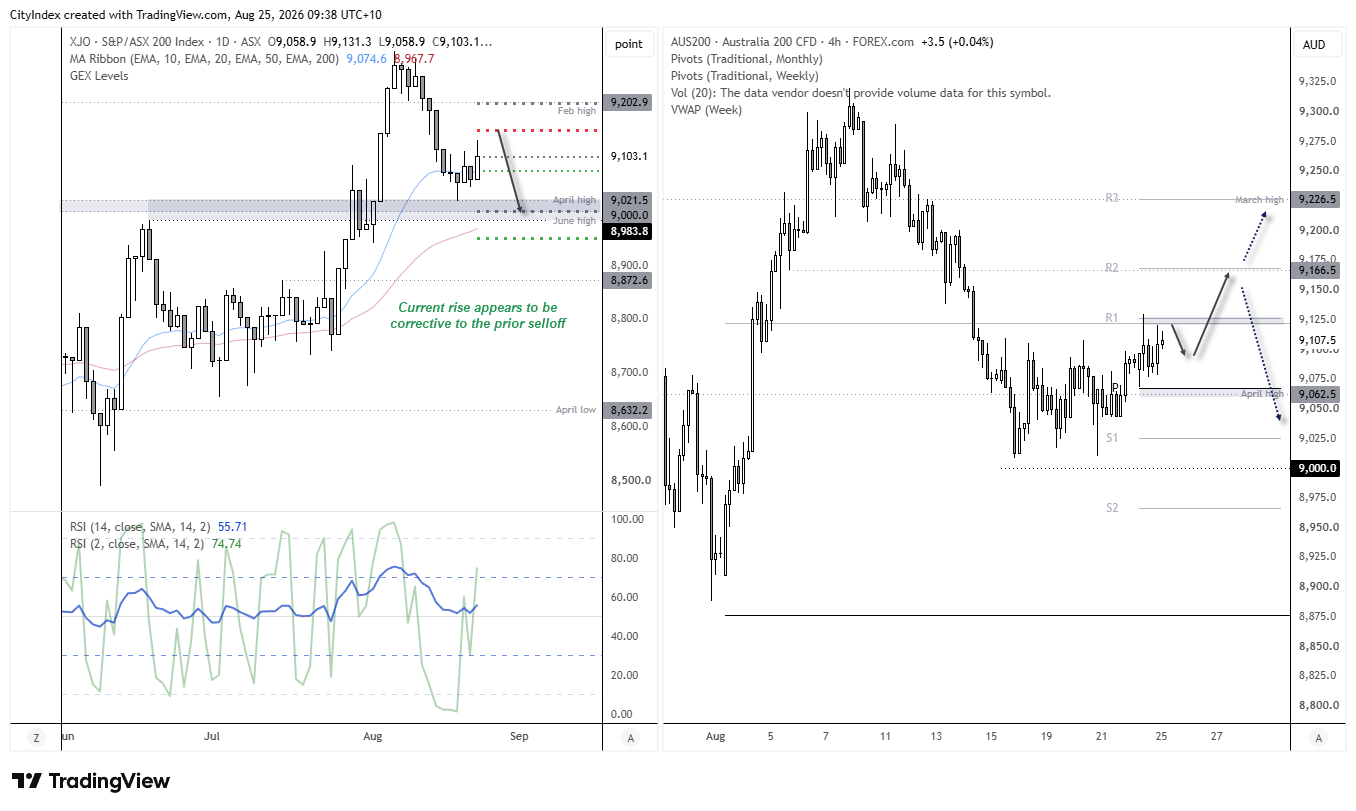
The ASX 200 is trading in a congested area around 9,100, which is likely to keep price action choppy until the index breaks decisively in either direction.
Source: ASX, LSEG
- On the upside, 9,150 is the main resistance level. A sustained break above it would improve the bullish outlook and put 9,200 in focus as the next likely target.
- On the downside, 9,075 is the first area of support, followed by the more important 9,000 level. A break below 9,000 would weaken the near-term outlook and increase the risk of a move towards 8,950, which stands out as the stronger support zone.\]
- For now, 9,100–9,150 is the key decision area. Holding above 9,100 keeps the bias mildly constructive, while rejection from 9,150 would favour another move back towards 9,075 and 9,000.
- Support: 9,075, 9,000, 8,950, Resistance: 9,150, 9,200