
Gold Talking Points:
- As looked at in yesterday’s webinar the US Dollar had an open door for breakout and that’s extended so far today, helping to dent Gold prices with another test back below the $4k psychological level.
- While expectations are high for more rate hikes out of the US, Gold is on its back foot again following yesterday’s CPI report and the comment from Christopher Waller about a possible 50 bp hike in December.
- So far, that $4k level has seen defense from a longer-term perspective but the question now is whether the weekly close below that price a few weeks ago was sign of buying interest below $4k beginning to slow down.
The $4k level has been a big deal for Gold so far this year. While the fundamental backdrop has been non-ideal for Gold bulls, there’s also been a tendency for buyers to show up to support tests below the psychological $4k level. And this really highlights the divergence between short and long-terms, where the Fed is widely expected to hike rates in effort of stemming inflation but, big picture, the fiscal forces of continued government spending and debt expansion buffer that short-term bearishness, at least to some degree.
This all came into the spotlight this summer, just after Kevin Warsh’s first rate decision atop the Fed when he and the Fed’s dot plot matrix took markets by surprise. This erased a prior bounce in Gold and sent the metal down for that first $4k test in 2026. That theme persisted and for the next six week, we had grind at the big figure until bulls were ultimately able to prod a topside breakout.
Gold Weekly Price Chart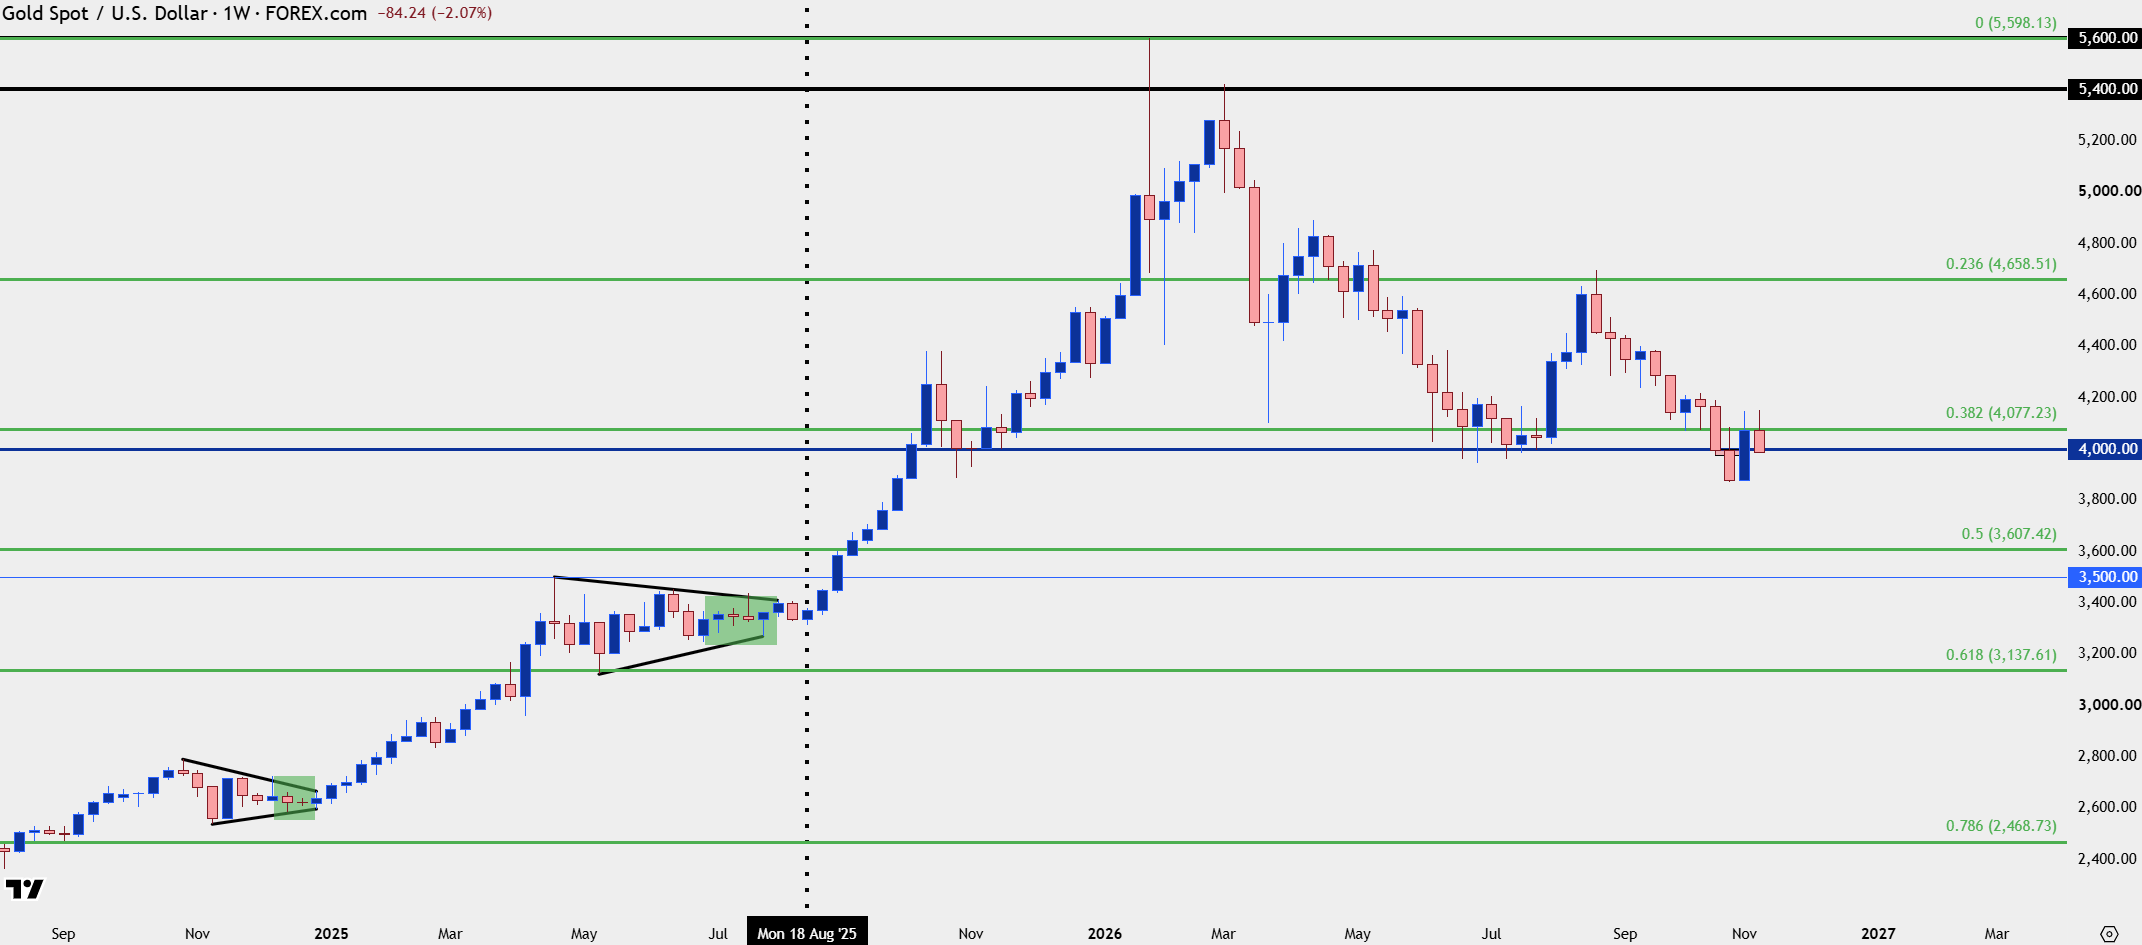
Chart prepared by James Stanley; data derived from Tradingview
Gold Daily
With Gold back below the $4k level the question now is whether we see some element of bullish anticipation. This would ideal present as buyers coming in at a higher-low, above the swing low from two weeks ago that led to the slingshot move last week. That price, however, is all the way down at $3870, so there’s still quite a bit of room. Also of interest from the daily chart is the prior 2026 swing low at $3942, which has a bit of relevance on shorter-terms, as well, which I’ll look at below.
Gold Daily Chart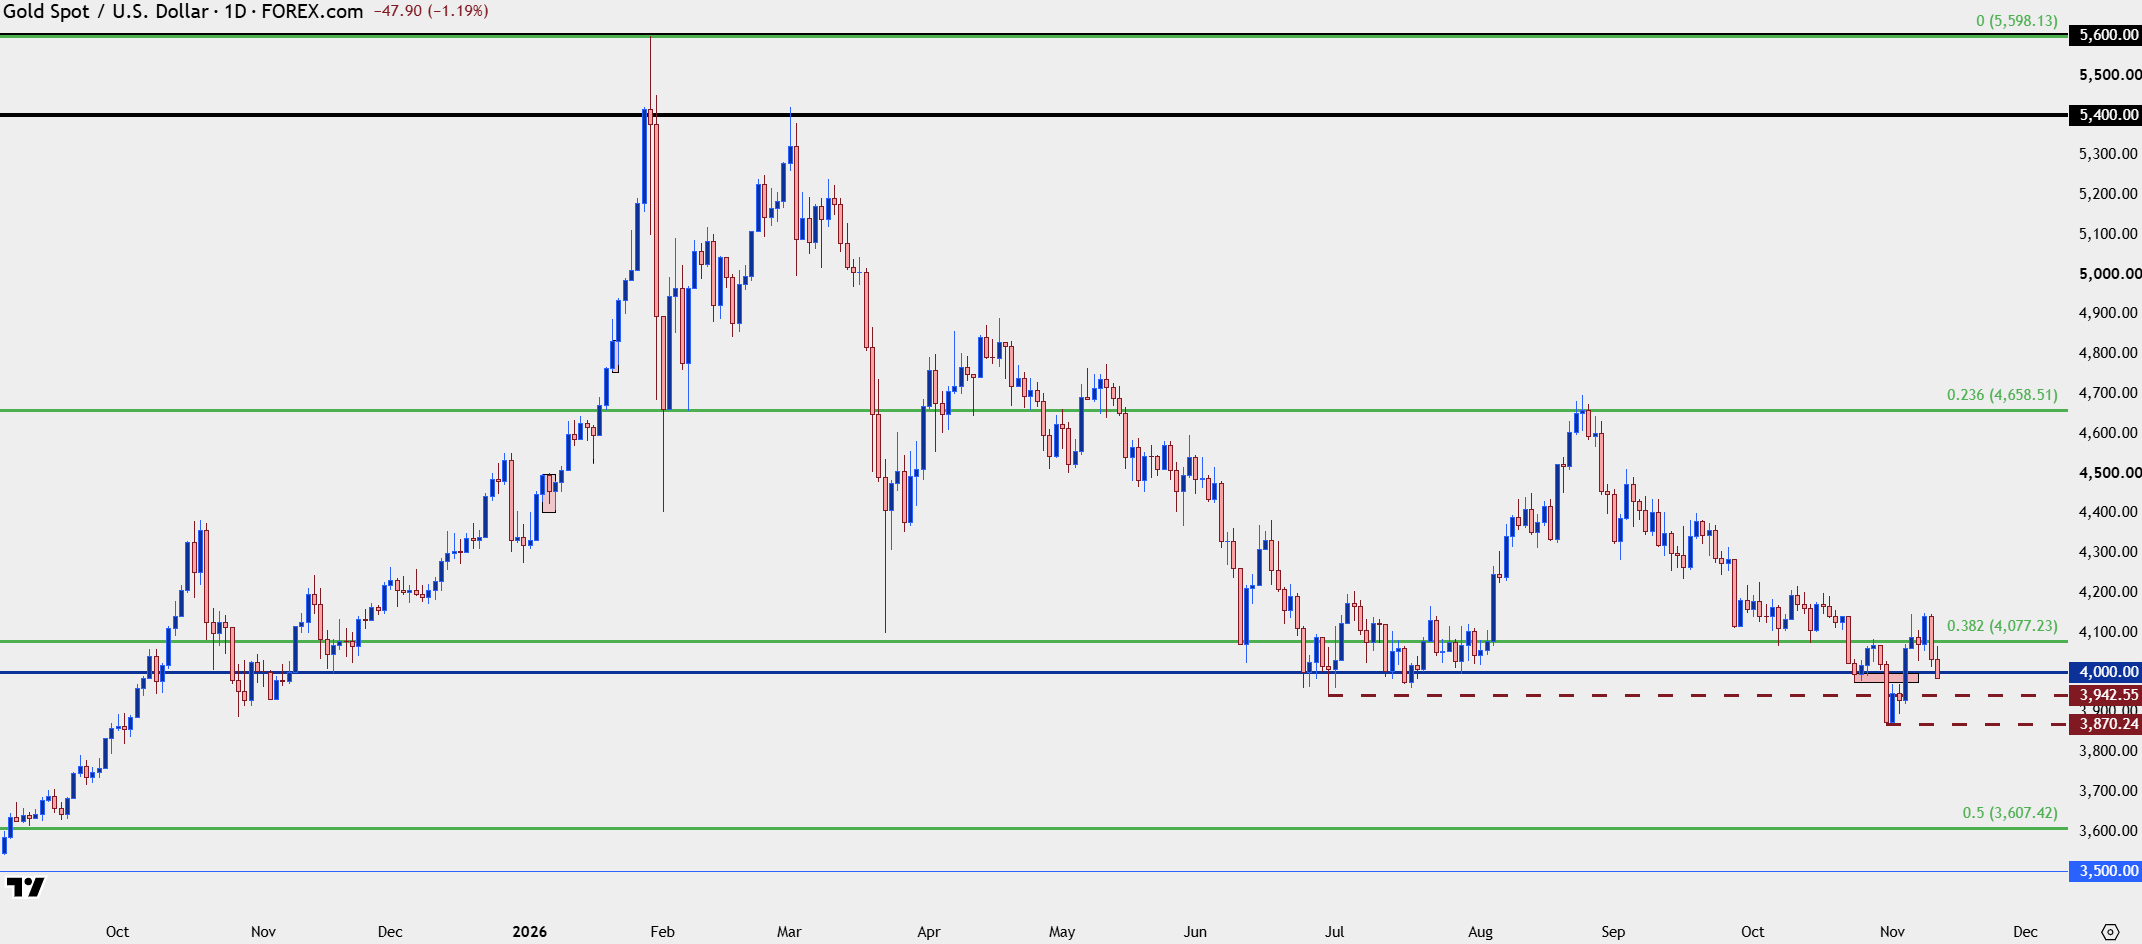
Chart prepared by James Stanley; data derived from Tradingview
Gold Short-Term
The next level down is the prior lower-high before the breakout and rally back above the $4k handle. This plots at $3970, and below that we can see that same $3942 level referenced above as a spot of short-term support-turned-resistance. Either of those levels could present the bullish anticipation argument behind gold prices.
But from this four-hour chart, there’s another item to work with…
The highs last week at 4147 set up a double top formation, and the neckline for that formation was at 4027 which offers $120 of distance. With a double top, a break of the neckline projects a possible move of similar size, which would point to a push down towards $3906. While a sell-off extending all the way down there certainly would seem to hit the bullish anticipation argument, it would still allow for a higher-low above the prior swing low of $3870.
Gold Four-Hour Price Chart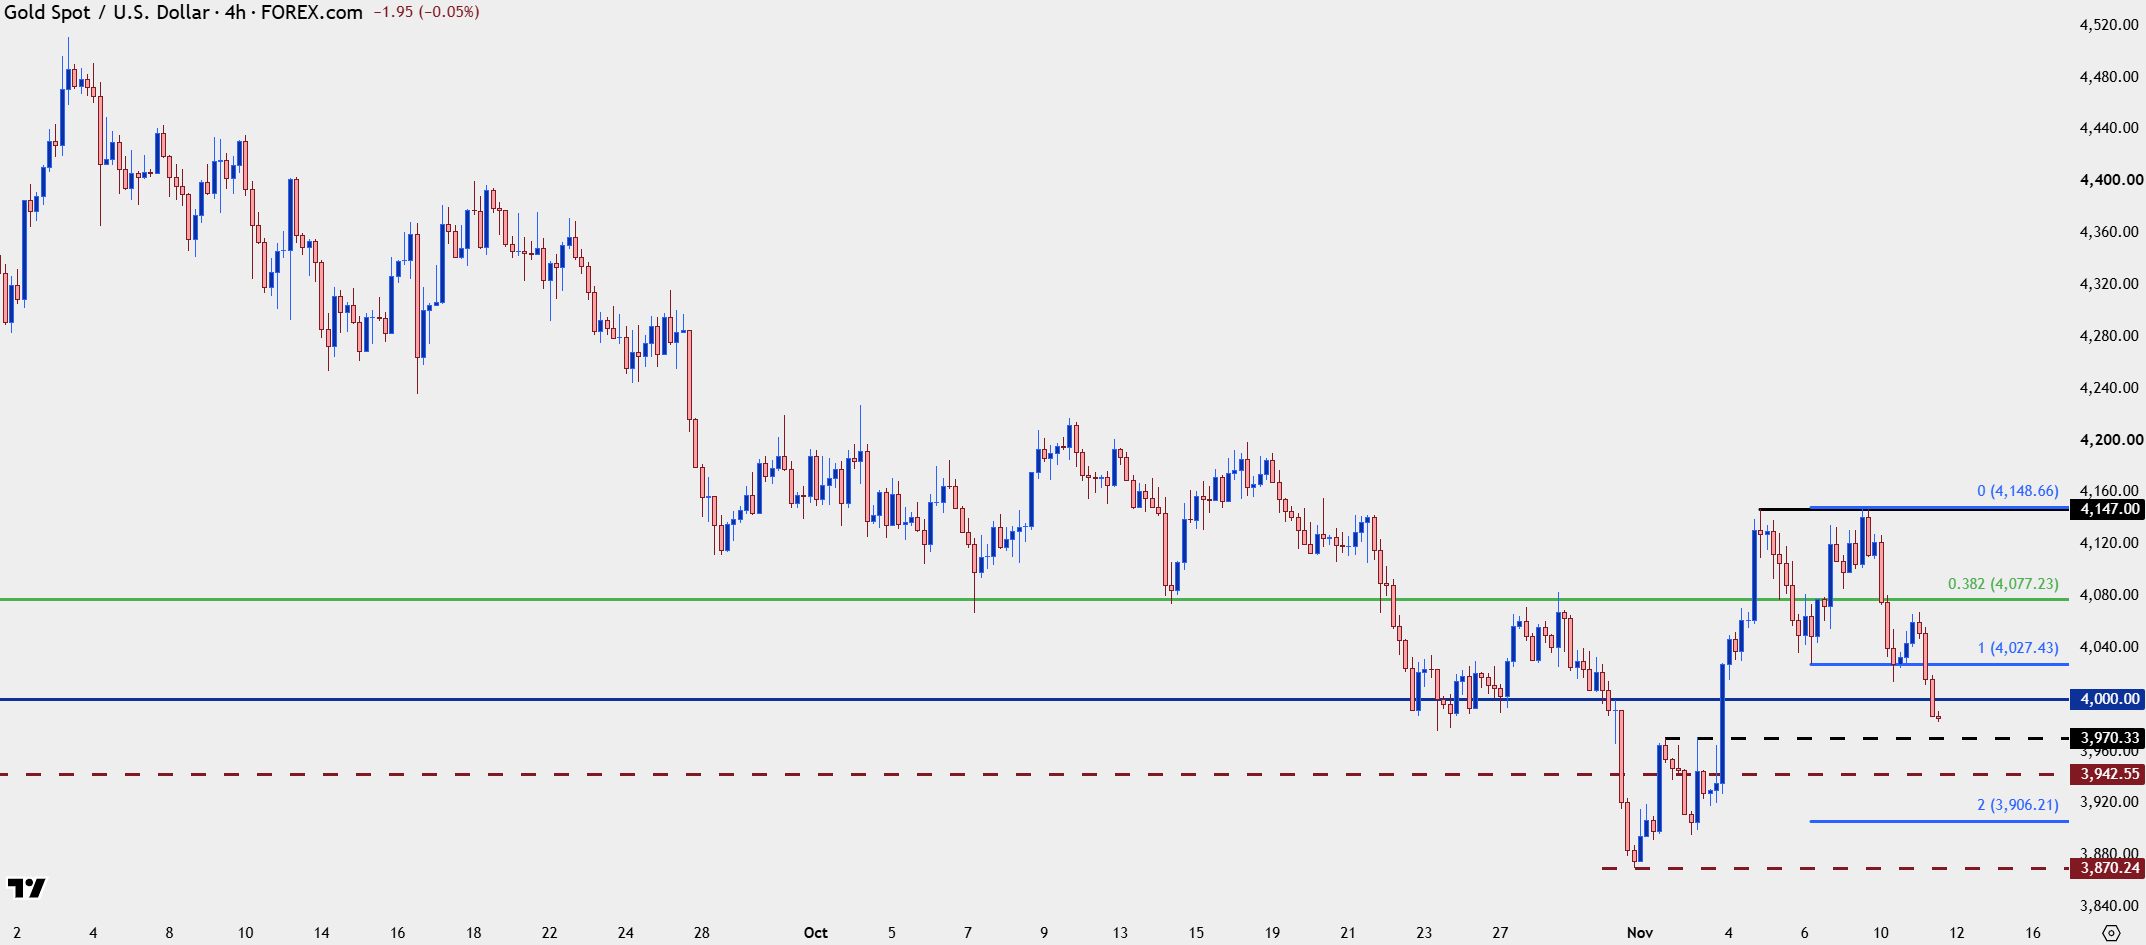
Chart prepared by James Stanley; data derived from Tradingview
--- written by James Stanley, Senior Market Analyst, Global Macro