US Dollar Outlook: AUD/USD
AUD/USD may attempt to retrace the decline from the July high (0.6895) as it extends the recent series of higher highs and lows, but the Relative Strength Index (RSI) appears to be diverging with price as the oscillator struggles to push into overbought territory.
AUD/USD Rate Forecast: RSI Divergence Emerges
AUD/USD registers a fresh monthly high (0.6797) as the final reading for the US Gross Domestic Product (GDP) report shows a downward revision from the preliminary print, with the economy growing 4.9% in the third quarter versus an initial forecast of 5.2%.
Join David Song for the Weekly Fundamental Market Outlook webinar. Register Here
Signs of a slowing economy may sway the Federal Reserve as ‘tight policy is putting downward pressure on economic activity and inflation,’ and the central bank may come under pressure to implement a rate-cut sooner rather than later as the update to the US Personal Consumption Expenditure (PCE) Price Index is expected to reveal slowing inflation.
US Economic Calendar

The core PCE, the Fed’s preferred gauge for inflation, is seen narrowing to 3.3% in November from 3.5% per annum the month prior, and signs of easing price growth may fuel the recent rally in AUD/USD as boosts speculation for lower US interest rates in 2024.
However, a higher-than-expected core PCE reading may generate a bullish reaction in the Greenback as it encourages Chairman Jerome Powell and Co. to further combat inflation, and speculation surrounding US monetary policy may sway AUD/USD ahead of the next Federal Open Market Committee (FOMC) rate decision on January 31 as the Reserve Bank of Australia (RBA) is scheduled to hold its first 2024 meeting on February 6.
With that said, recent price action may lead to a test the July high (0.6895) as AUD/USD continues to carve a series of higher highs and lows, but the Relative Strength Index (RSI) may diverge with price as the oscillator struggles to climb above 70 to trigger an overbought reading.
AUD/USD Price Chart – Daily
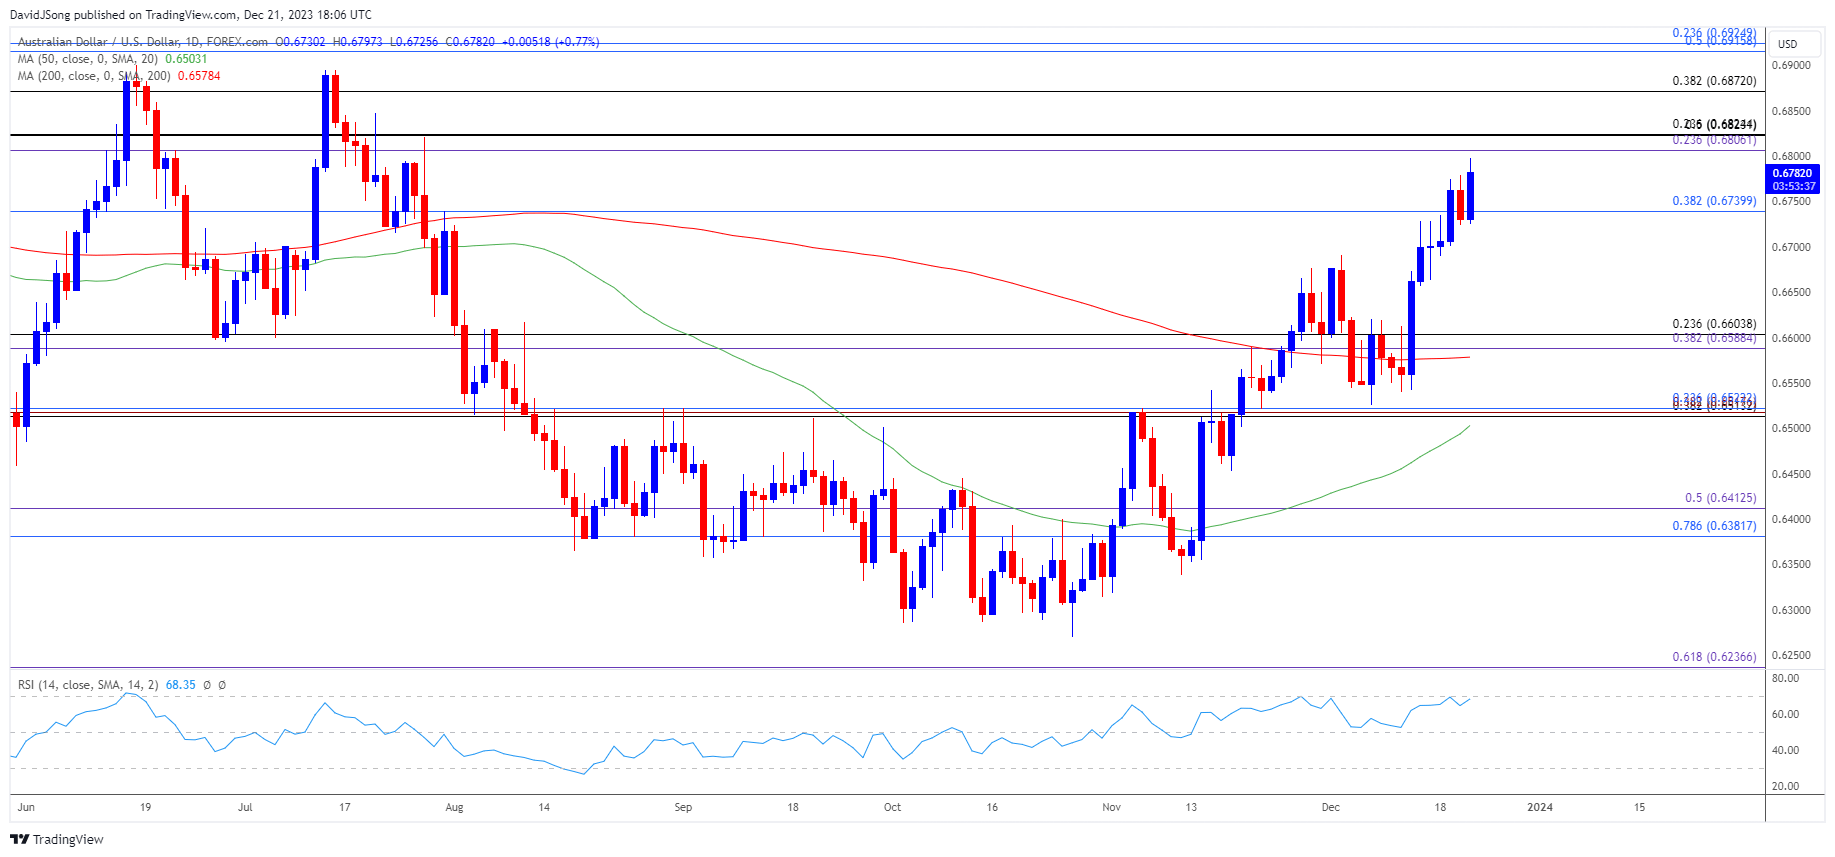
Chart Prepared by David Song, Strategist; AUD/USD on TradingView
- AUD/USD extends the recent series of higher highs and lows to register a fresh monthly high (0.6797), with a break/close above the 0.6810 (23.6% Fibonacci extension) to 0.6820 (23.6% Fibonacci retracement) region raising the scope for a move towards 0.8670 (38.2% Fibonacci retracement).
- Next area of interest comes in around the July high (0.6895), but the Relative Strength Index (RSI) may mirror the developments from last month as it struggles to push into overbought territory.
- In turn, the RSI may diverge with the bullish price action in AUD/USD, with a move below 0.6740 (38.2% Fibonacci retracement) bringing the 0.6590 (38.2% Fibonacci extension) to 0.6600 (23.6% Fibonacci retracement) region back on the radar.
Additional Market Outlooks
US Dollar Forecast: GBP/USD Ascending Channel Remains Intact
US Dollar Forecast: USD/JPY Rebound Pulls RSI Out of Oversold Zone
--- Written by David Song, Strategist
Follow on Twitter at @DavidJSong