
The US Dollar took a hit at the FOMC meeting yesterday and that’s helped both Gold and Silver to push breakouts. Bitcoin, however, is still grasping for support at the 90k level, although a pattern of higher-lows gives bulls some hope that rallies may be ahead.

It’s been a rough Q4 for Bitcoin after the failure to break out from the 125k level earlier in the quarter. There seemed to be an inverse relationship with the Dollar, as the USD rallied and broke out from a falling wedge, the sell-off in Bitcoin continued until there was a max move of -36.22%, with buyers coming in just above the 80k level.
Since then, the USD has been on its back foot, and there has been a bounce in Bitcoin, although the recovery in the cryptocurrency has seemingly lagged behind the mirror image of the reversal in the USD. From the weekly chart, the bounce still appears indecisive and we can see upper wicks on the past three weekly candles highlighting selling pressure that’s shown on bounces; and of specific interest, it’s the 90k level that BTC has had trouble holding above for any extended runs.
Bitcoin Weekly Chart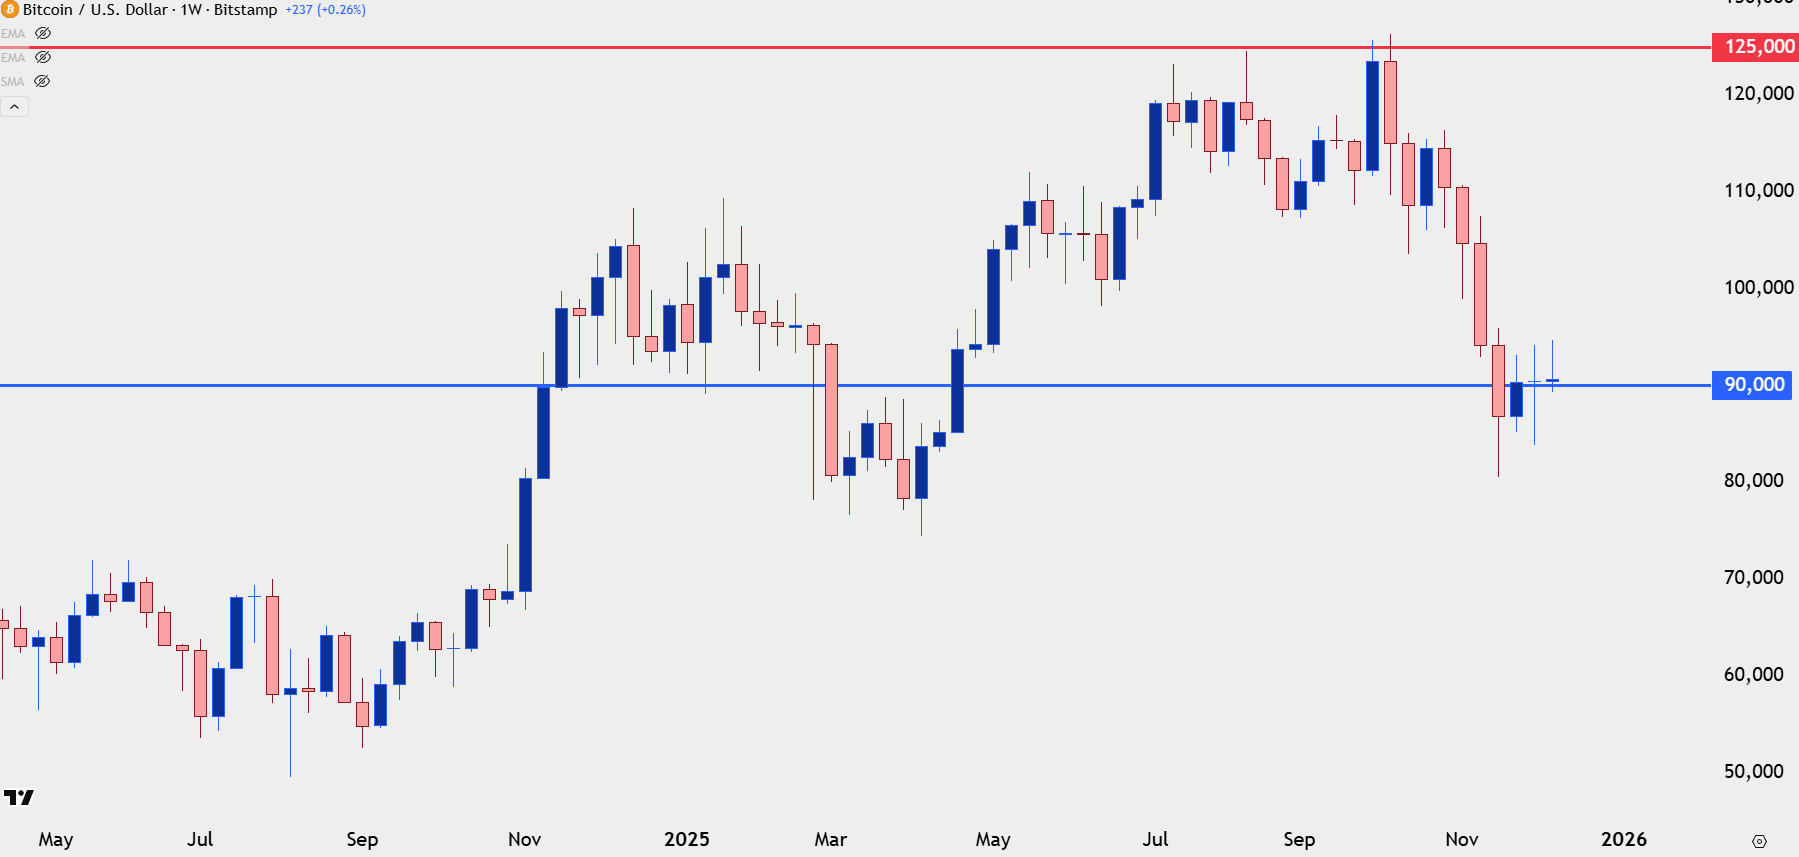
Chart prepared by James Stanley; data derived from Tradingview
Bitcoin 90k Acceptance
From the daily chart the picture isn’t quite as bleak as there’s a couple of items that bulls can hang their hats on: Ever since the push towards 80k, there’s been a build of higher lows. And alongside that, there’s been a growing acceptance of the 90k level to go along with those higher lows as we’ve also seen rallies budge just a bit higher, evidenced by the Monday run up to 94,652.
The downside to this would be the fact that the fundamental backdrop has been seemingly positive for the long side of Bitcoin as we’ve seen breakouts in both Silver and Gold, yet Bitcoin hasn’t been able to show strength in nearly as prominent of a manner.
Bitcoin Daily Chart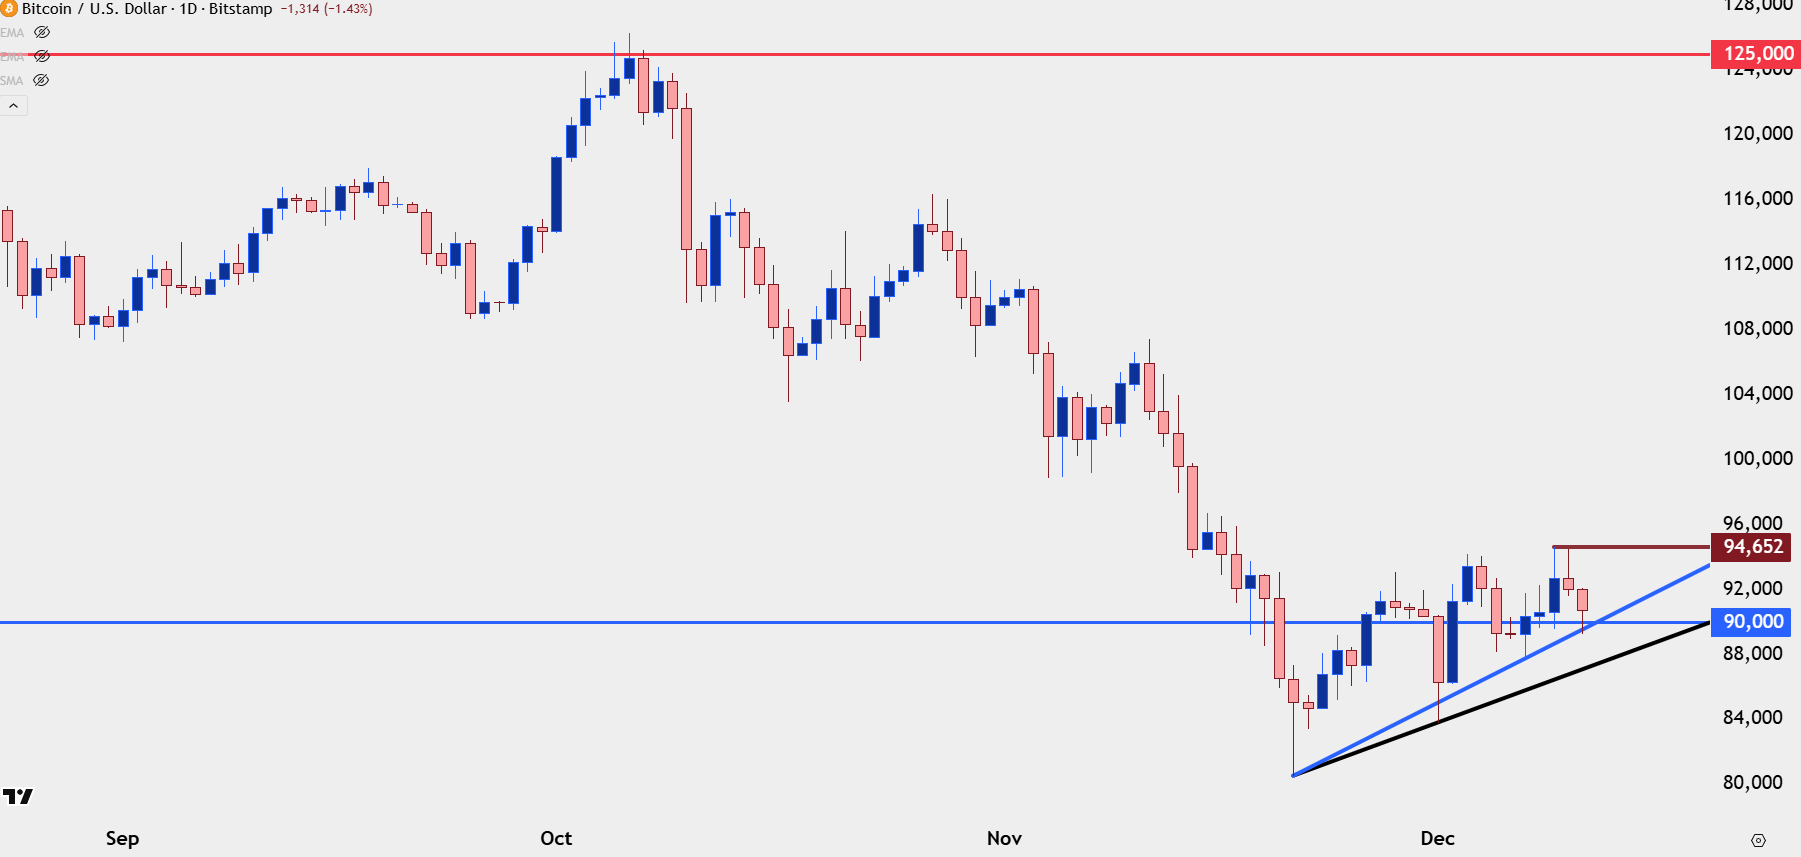
Chart prepared by James Stanley; data derived from Tradingview
Bitcoin: Two Paths Forward
At this point there’s a case that can be made on either side given that juxtaposition looked at above. For bulls, there’s the lack of follow-through on the breakdown move and a recent pattern of higher-lows. For bears, the deduction that Bitcoin hasn’t quite shown much even as the USD has broken down and other anti-fiat vehicles have broken out.
For bulls – it’s the shorter-term chart that’s of more interest as that can at least show the recent patterning of higher-highs and higher-lows, providing some structure that can be worked with on the long side in looking for rallies to continue.
And from the four-hour chart, there’s even an ascending triangle formation that can be argued, with a spot of support-turned-resistance coming in to hold the horizontal resistance for the formation at 93,961. The next significant resistance beyond that is just below the 100k level, with the prior swing at 99,939 standing out.
Bitcoin Four-Hour Chart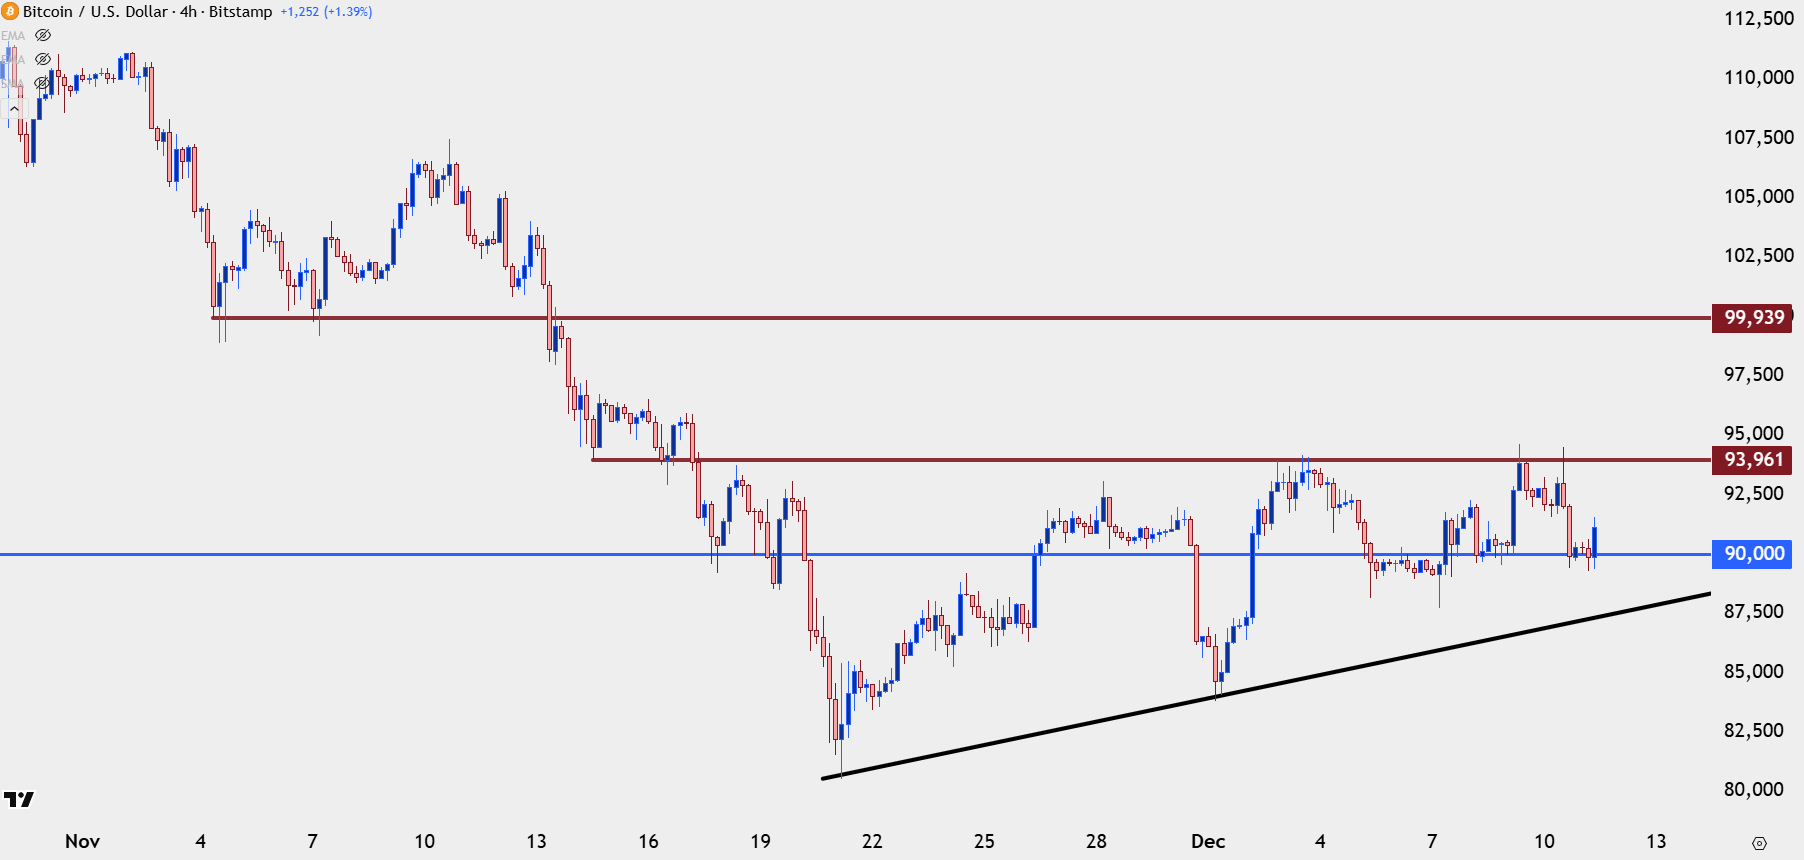
Chart prepared by James Stanley; data derived from Tradingview
--- written by James Stanley, Senior Market Analyst, Global Macro