Is history repeating itself, or is Bitcoin set to re-stake it’s claim on the bullish trend that went to sleep late last year?
From the monthly chart, Bitcoin is working on a morning star formation following a grinding test at the 65k level over the past two months. There’s still time until this confirms, of course, but the tonality change is clear as the brutal five-month-sell off met indecision last month, followed by a rally so far in April.
Bitcoin (BTC/USD) Monthly Chart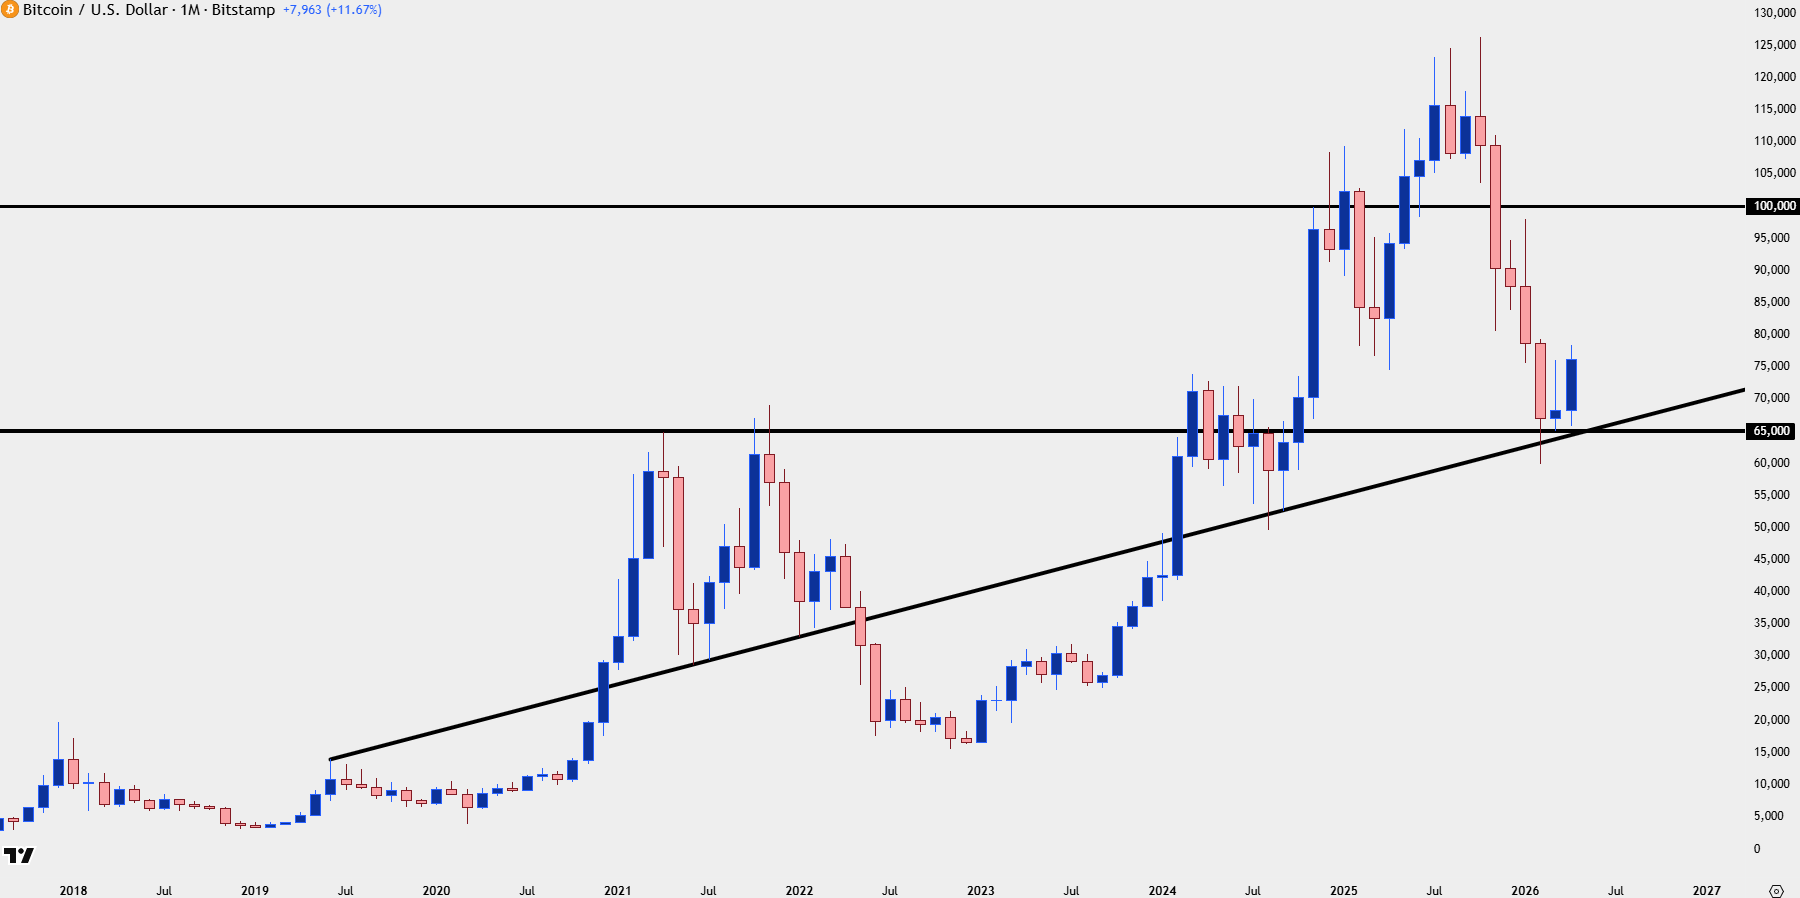
Chart prepared by James Stanley; data derived from Tradingview
Bitcoin Weekly
Last week saw buyers press a fresh high but so far they haven’t been able to continue the move. From the weekly, we can see that price is currently at a massive spot on the chart, around the 76,600 level that was support a year ago.
Bitcoin (BTC/USD) Weekly Chart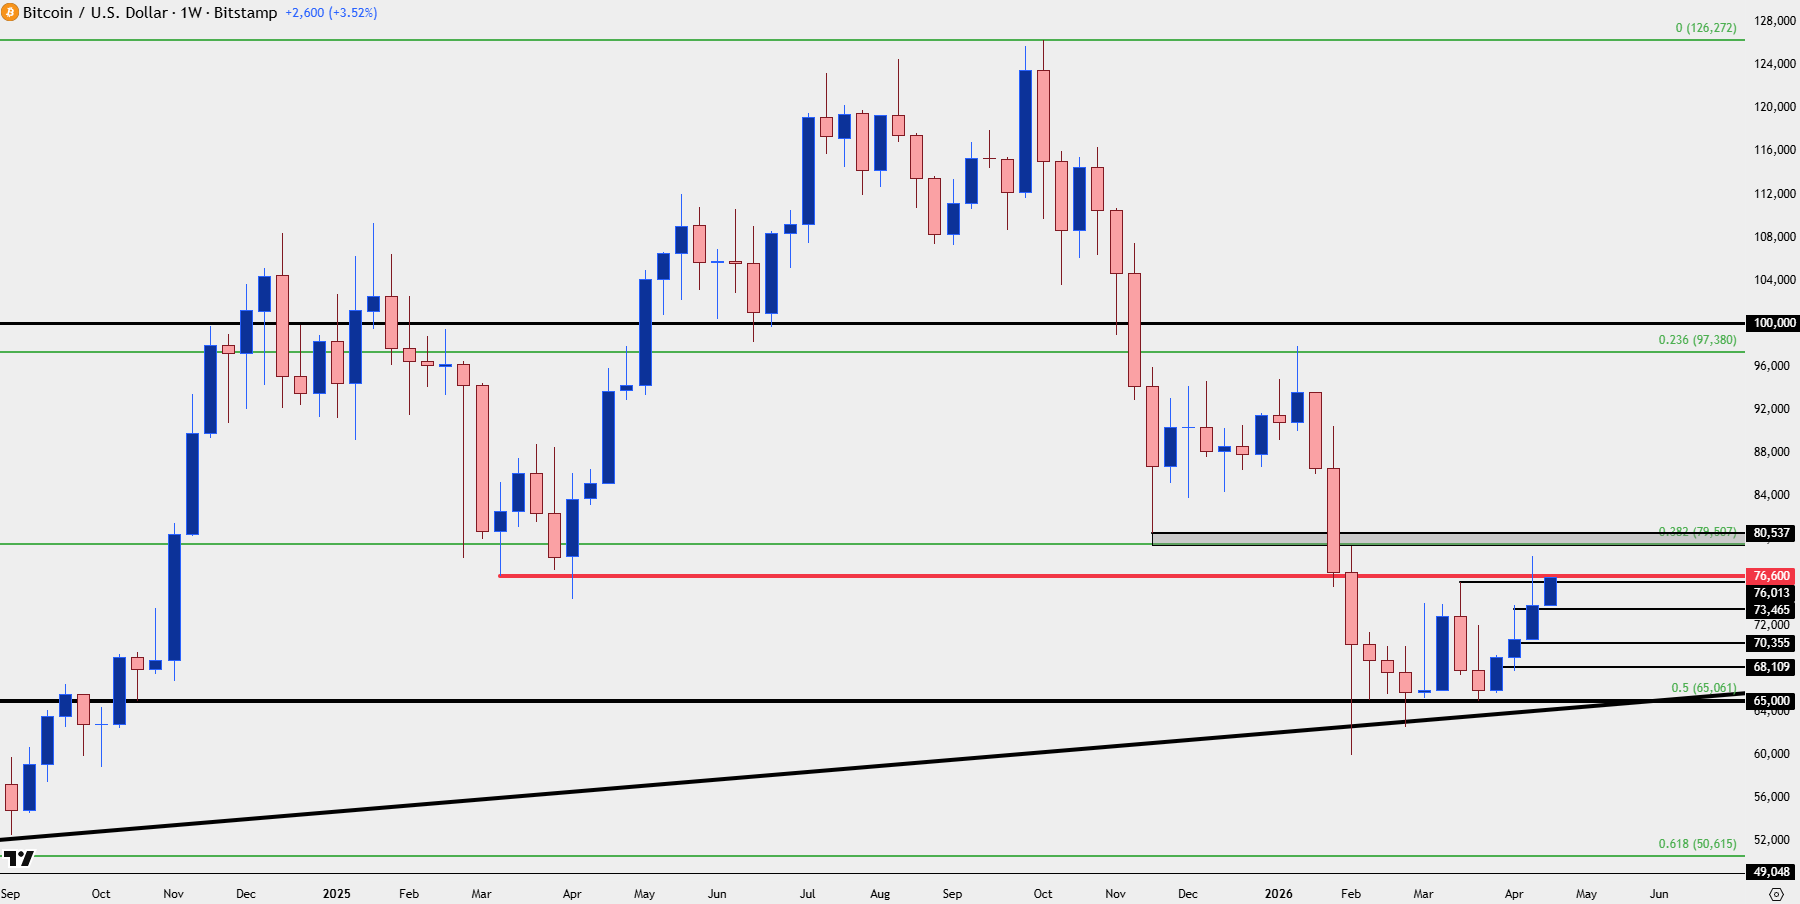
Chart prepared by James Stanley; data derived from Tradingview
Bitcoin Daily Chart
From the daily chart we can see some familiarity with this pattern as something similar set up back in November and December. It was an ascending triangle formation and there was even an initial bullish breakout. But sellers came in to swat the move down and for that last iteration, at least, it led to fresh lower-lows.
At this point, we don’t quite have that yet as buyers have come in to hold higher-low support following the initial pullback from the breakout. This puts even more emphasis and focus on short-term price action and structure for BTC/USD.
Bitcoin Daily Chart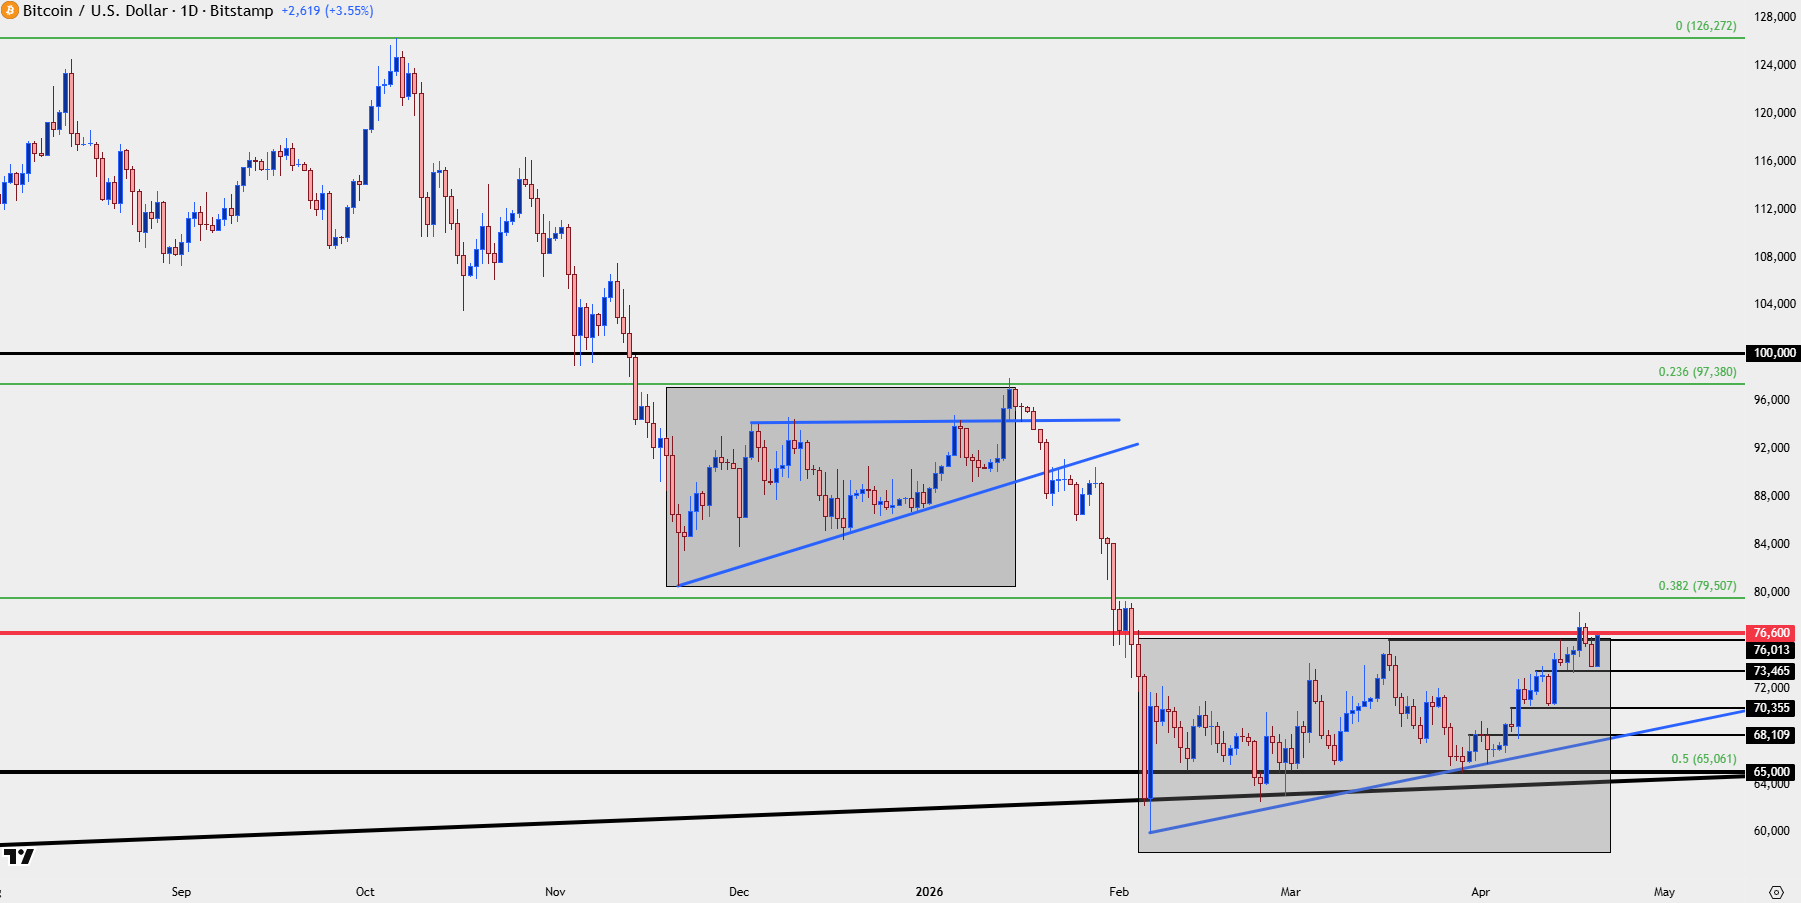
Chart prepared by James Stanley; data derived from Tradingview
Bitcoin Short-Term
From the four-hour chart, we can see where bulls have so far defended support at prior resistance and they’re making another run at the 76,600 level, after which the next obvious point is the 78,834 high followed by the 79,507 Fibonacci level. Above that, the 80k level looms large.
Bitcoin (BTC/USD) Four-Hour Price Chart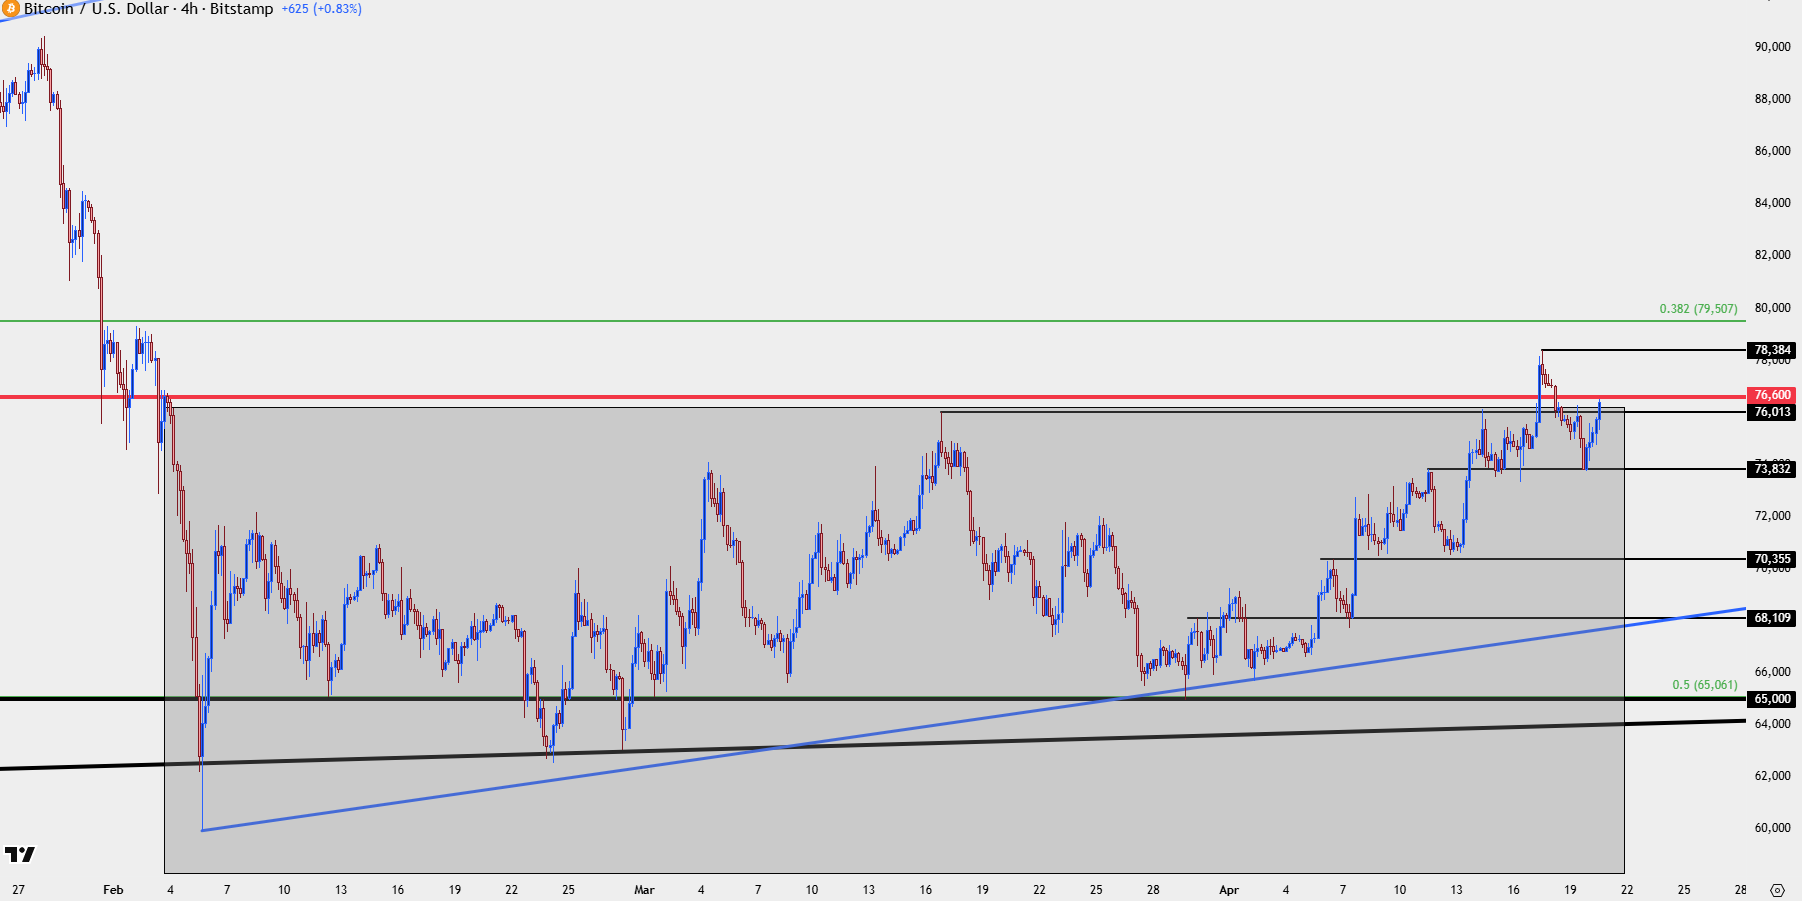
Chart prepared by James Stanley; data derived from Tradingview
--- written by James Stanley, Senior Market Analyst, Global Macro