
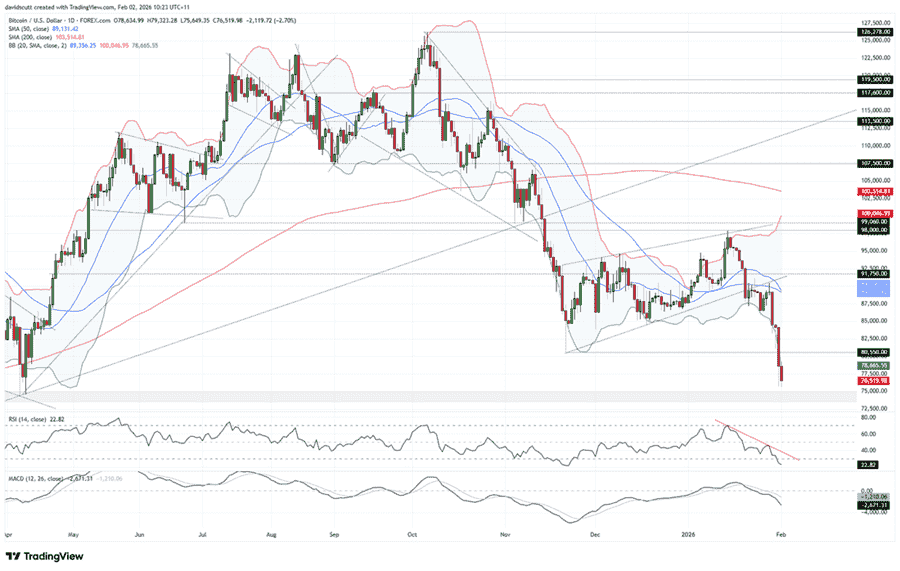
Bitcoin’s latest slide makes plenty of sense from both a technical and fundamental perspective. A bearish break from the rising wedge it had been coiling within delivered a textbook retracement back to where the structure first formed in late November. That was followed by news on Friday that Donald Trump would nominate former Federal Reserve governor Kevin Warsh as the replacement for outgoing Fed chair Jerome Powell.
Warsh’s past criticism of QE and the Fed’s use of its balance sheet to enhance monetary policy transmission triggered an immediate unwind in trades that had benefitted from currency debasement concerns, including bitcoin and other crypto tokens. The move extended over the weekend, assisted by forced long liquidations, leaving bitcoin trading at levels not seen since April 2025, immediately after the Liberation Day tariff risk rout.
While buying right now remains a low probability play given the price action, resembling something closer to catching a falling knife, BTC/USD is now extremely stretched. That creates the type of condition that could easily spark a countertrend squeeze given the speed and scale of the recent falls.
Source: TradingView
Looking at the daily timeframe, RSI (14) continues to trend deeper into oversold territory, sitting at 22.03, similar to levels seen in November 2025 just ahead of a bounce. As was the case then, price is also trading below the lower Bollinger Band, again reinforcing how stretched bitcoin looks after falling more than 20% since mid January.
Of course, stretched short-term positioning and oversold conditions are not a reason to buy in isolation, particularly at a time when downside momentum is strengthening rather than slowing. However, with bitcoin now approaching a zone between $75,000 and $73,500 that has previously acted as both support and resistance, near-term price action above and within this area could prove instructive in assessing whether the risk of a countertrend squeeze is increasing.
Should a notable bottoming pattern emerge on a shorter timeframe such as the hourlies, whether a hammer, bullish pin or a multi-candle formation like a morning star, the option would be there to buy with a stop below the recent lows. Initial upside targets would include the November 21 low at $80,550, with $85,000 another area of interest given price bounced there on multiple occasions prior to the latest breakdown.
Given the bearish message from both price action and oscillators, there is no need to move pre-emptively to set longs. For now, the idea remains firmly in watch-and-wait mode until a clear signal emerges.