
As the trading week comes to an end, one of the most relevant developments in the FX market has been the renewed strength of the Japanese yen. This can be seen in the recent performance of USD/JPY, which has fallen nearly 1.0% over the last two trading sessions, highlighting a meaningful recovery in the Japanese currency against the U.S. dollar.
For now, the selling pressure observed around the pair is being driven primarily by the loss of momentum in U.S. Treasury yields. This has been reinforced by Japan's latest inflation data, released toward the end of the week, which has started to strengthen expectations of a potentially more aggressive Bank of Japan in the coming months. As a result, the yen has managed to recover part of the ground lost in previous months and, as long as these catalysts continue to support the Japanese currency, selling pressure around USD/JPY could remain relevant in the sessions ahead.

Is the Dollar Beginning to Lose Strength?
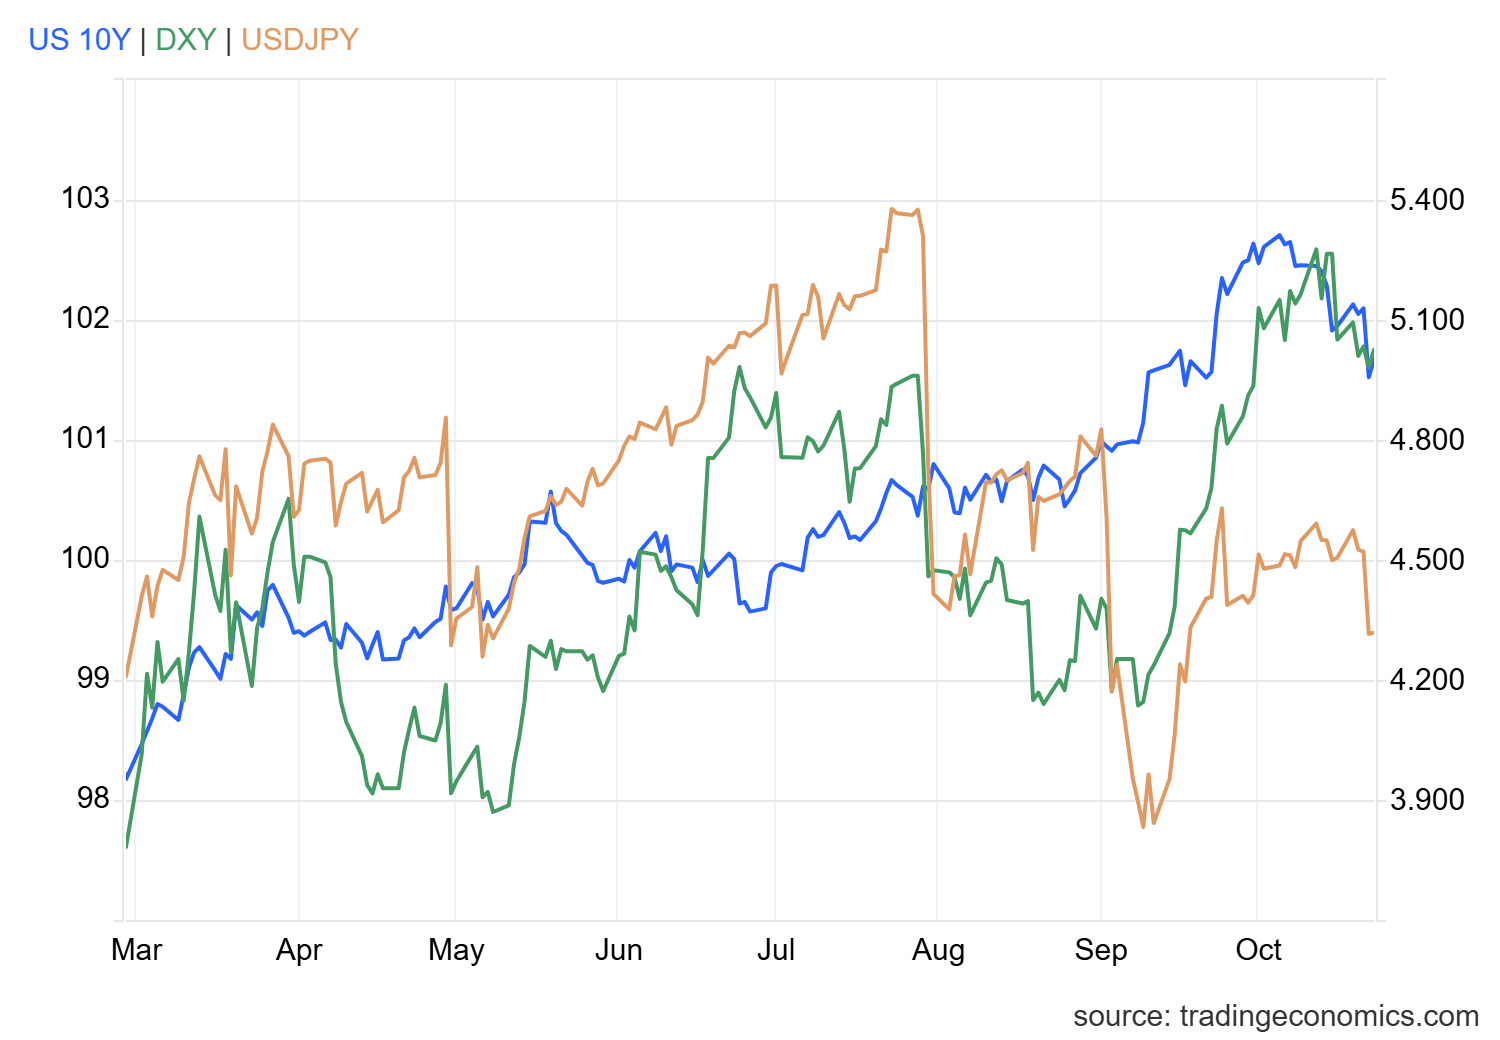
A loss of momentum around the U.S. dollar became increasingly evident throughout the week. Part of this dynamic has been driven by the moderation observed in 10-year U.S. Treasury yields, which temporarily moved below the 5.0% area.
This development is important because lower yields reduce part of the relative attractiveness of dollar-denominated investments. As a result, demand for the U.S. currency may also begin to soften in the short term.
The impact has already started to become visible in the behavior of the DXY, the index that measures the strength of the dollar against its main peers. In recent sessions, the index has retreated consistently, moving away from its yearly highs and currently trading near the 102-point area. This decline suggests that demand for the dollar has begun to moderate after several weeks of relatively solid strength, a dynamic that appears closely linked to the loss of momentum in the U.S. bond market.
Source: TradingEconomics
This behavior is particularly relevant because, as part of the relative advantage of holding dollar-denominated assets begins to fade, other currencies such as the yen have started to recover ground. In fact, the recent strength observed in the Japanese currency appears closely tied to this loss of relative attractiveness within U.S. financial markets.
As long as Treasury yields continue moving within a moderation phase, the yen could continue recovering part of the ground lost throughout much of 2026. Under this scenario, selling pressure around USD/JPY may remain an important factor influencing the pair in the short term.
Do Japan's Inflation Data Matter?
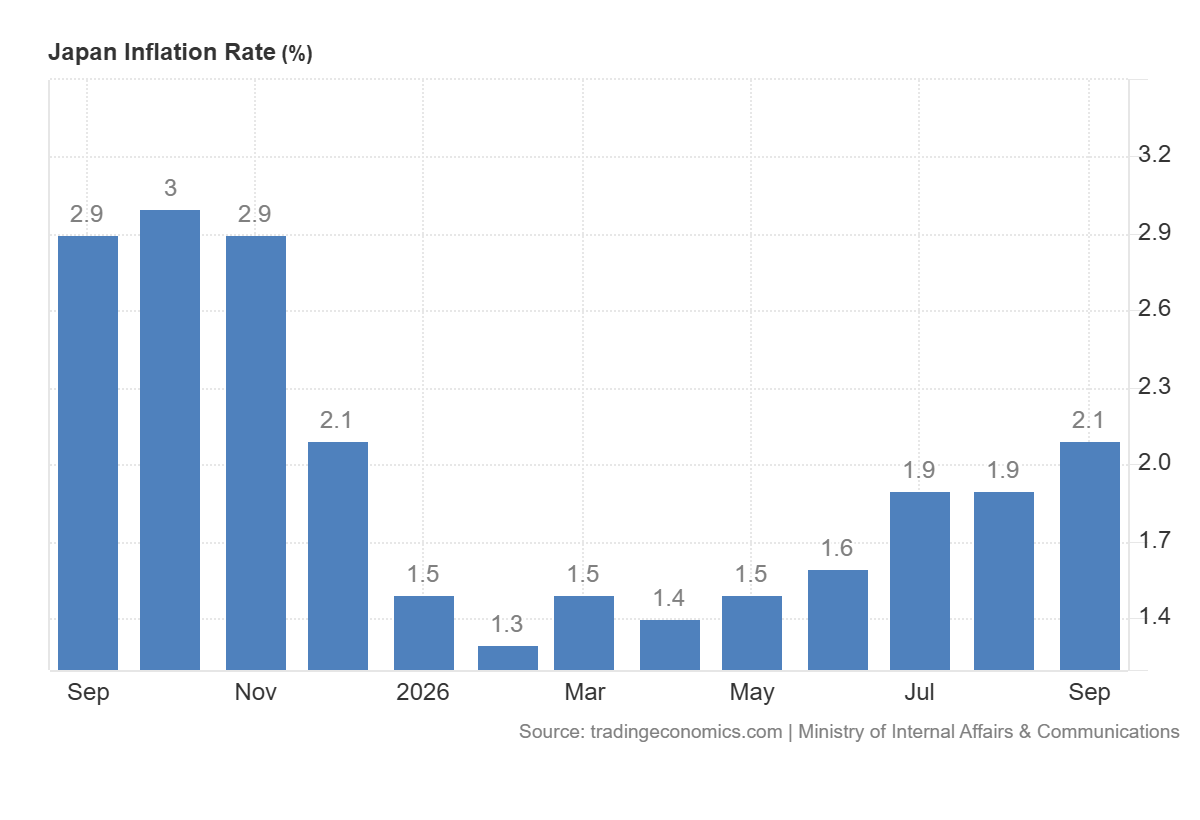
In addition to the weakness observed in the dollar, investors have also been paying close attention to Japan's latest inflation release. Annual inflation rose to 2.1%, reaching its highest level of 2026 and maintaining a relatively consistent upward trend over recent months.
This remains important because inflation is now developing slightly above the 2.0% target established by the Bank of Japan, a situation that could start generating greater concerns about inflationary pressures within the Japanese economy.
Source: TradingEconomics
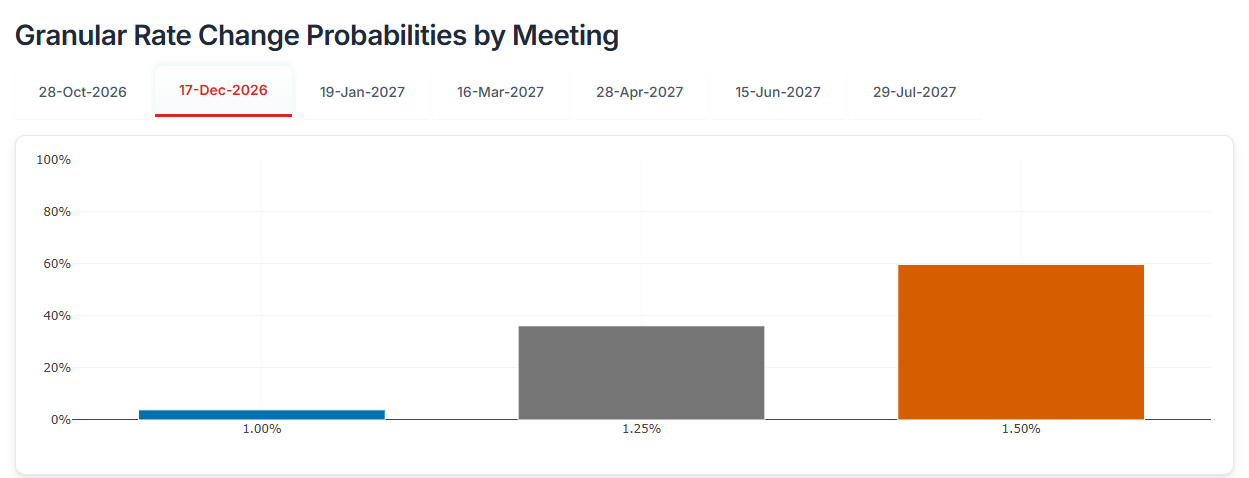
The data have also started to influence monetary policy expectations. Only a few weeks ago, markets were pricing more than a 90% probability that the Bank of Japan would leave its policy rate unchanged at 1.25% during the October 28 meeting. However, by the end of the week that probability had fallen toward 80% area.
At the same time, expectations for the December meeting now imply close to a 60% probability that interest rates could rise to 1.50%.
Source: Centralbankwatch
This suggests markets are increasingly positioning for a more aggressive Bank of Japan over the coming months. Although Japanese rates remain relatively low compared to the current 4.0% reference rate in the United States, it is important to remember that Japan has maintained exceptionally low rates for decades.
For this reason, any gradual shift toward a more restrictive monetary policy stance could begin to alter investor perceptions regarding yen-denominated assets. If this process continues, the interest-rate differential between Japan and other major economies could gradually narrow, eventually becoming a meaningful catalyst for demand for the Japanese currency.
As a result, if the Bank of Japan continues moving toward a more aggressive stance than markets have been accustomed to over recent years, selling pressure around USD/JPY could remain an important theme even beyond the short term.
USD/JPY Technical Forecast
Source: StoneX, Tradingview
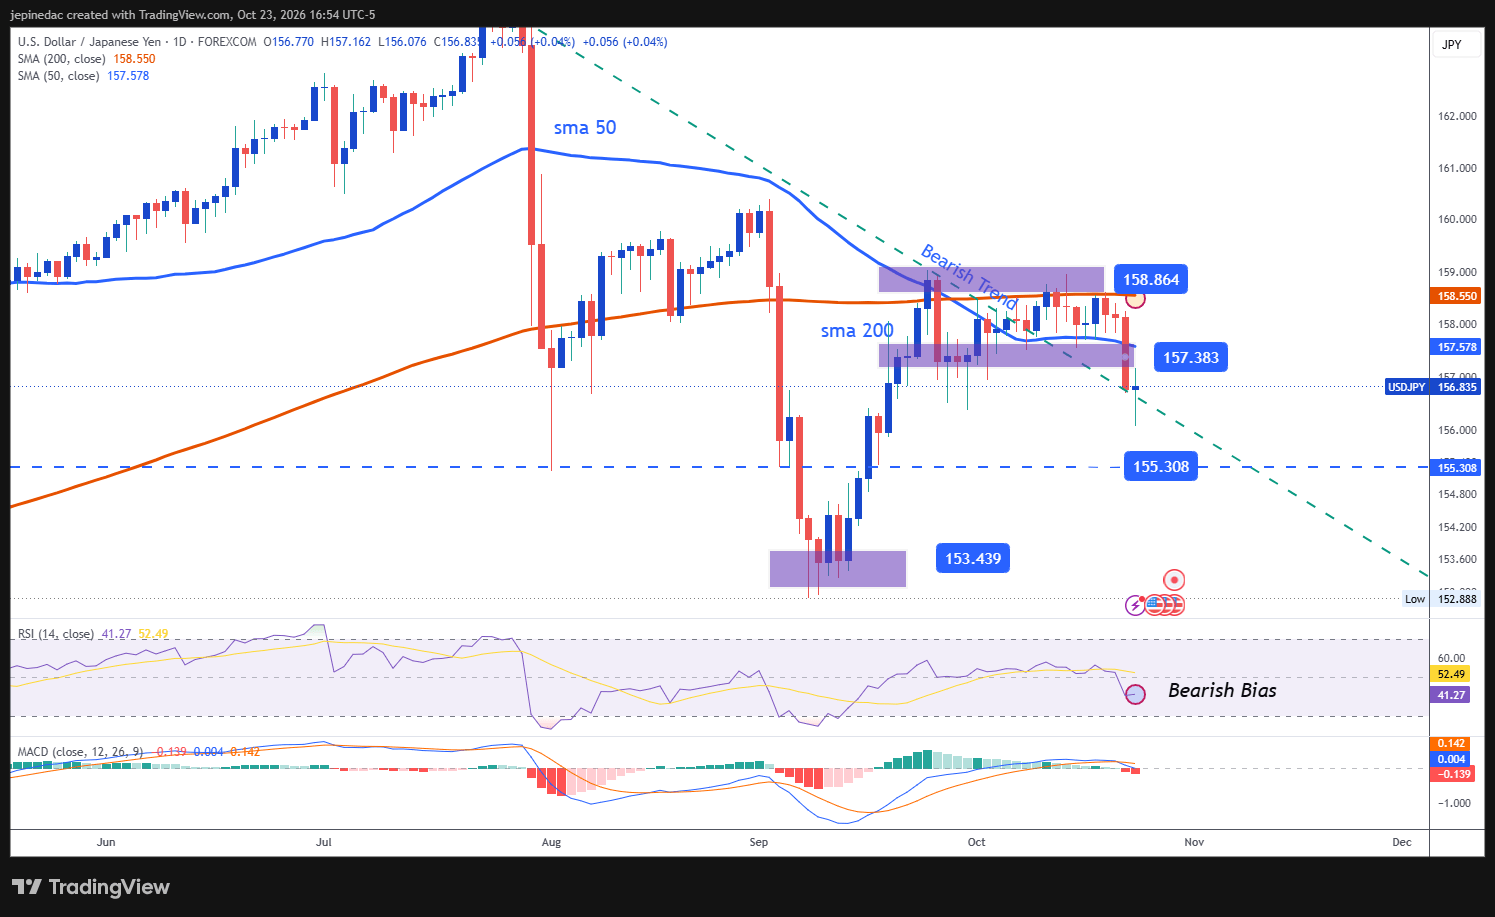
- The bearish bias is becoming relevant once again: Although USD/JPY had recently entered a phase of short-term neutrality after partially breaking the bearish trendline developed over previous months, recent price action has once again given prominence to selling pressure. As a result, the broader bearish structure is regaining relevance within the daily chart. As long as price continues approaching key support zones, the long-standing bearish trendline could once again become the dominant technical structure during the weeks ahead.
- MACD: The MACD histogram continues to trade slightly below the 0 neutral line, a reading that reflects weakening momentum within short-term moving averages. If this dynamic remains intact, it could continue supporting a more established bearish bias in the sessions ahead.
- RSI: A similar picture can be observed in the RSI, whose line remains below the 50 neutral level. This suggests that selling momentum has started to regain traction and supports the possibility that the bearish bias could remain relevant in the short term.
Key Levels:
- 158.86 – Key Resistance: A level that aligns with the 200-period simple moving average and represents the most important upside barrier in the short term. A sustained move above this reference could significantly alter the current technical structure and open the door to a more consistent bullish trend over the coming weeks.
- 157.38 – Near-Term Barrier: A level that coincides with the base of the recent consolidation range and also develops near the 50-period simple moving average. This could become the main level to monitor in the event of short-term bullish corrections.
- 155.30 – Key Support: A support zone established during previous weeks that remains one of the most important downside barriers on the chart. Price action returning toward this level could restore the dominance of selling pressure and reinforce the relevance of the broader bearish trendline as the market's primary technical structure over the coming weeks.
Written by Julian Pineda, CFA, CMT – Market Analyst
Follow him on: @julianpineda25