
Over the past five trading sessions, USD/CAD has maintained a notable bearish bias in favor of the Canadian dollar, accumulating a decline of more than 1% in the short term as the market approaches the upcoming policy decisions from the central banks of the United States and Canada. For now, the expectation of lower rates in the United States and a neutral stance in Canada continues to support the strength of the Canadian dollar, which could keep consistent selling pressure on USD/CAD during the next trading sessions.

What to Expect from the Central Banks?
Tomorrow’s session will be particularly important for both the U.S. dollar and the Canadian dollar, as it will mark the final interest rate decision of the year for both central banks. These announcements will also provide insight into each bank’s monetary policy direction heading into next year. At the moment, the central bank leaning most toward a lower-rate environment in the short term is the Federal Reserve, as recent comments from several members signal that the institution is prioritizing economic relief rather than maintaining an aggressive anti-inflation stance. With just one day remaining before the official decision, the CME Group probability model shows an 87.4% chance of a rate cut from 4.00% to 3.75% during the December 10 meeting.
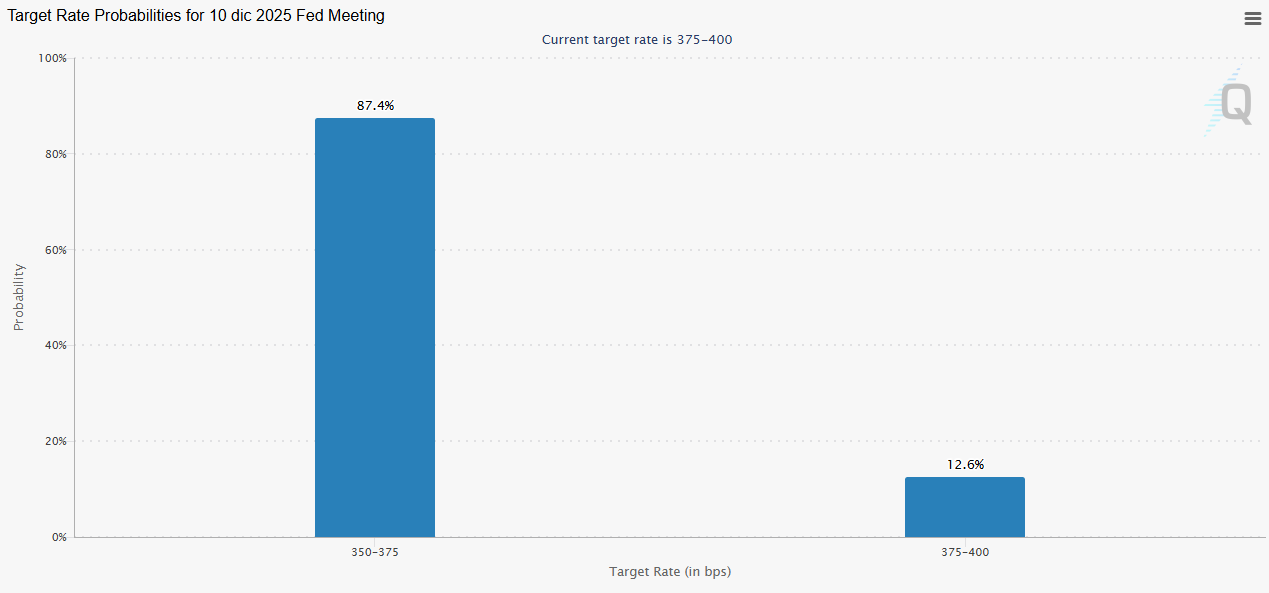
Source: CMEGROUP
The outlook for the Bank of Canada is quite different. A series of positive economic surprises—such as stronger-than-expected GDP growth of 2.6% annualized in the third quarter (well above the 0.5% forecast), and the addition of 53,600 jobs in November versus an expected loss of 5,000—has led the bank to reconsider its policy stance. Increased economic activity could generate inflationary pressures, especially considering that the central bank’s inflation target is 2.00%, while October inflation printed at 2.2%, still slightly above the target.

Source: TradingEconomics
Given these conditions, it is possible that, unlike the Federal Reserve, the Bank of Canada may lean toward maintaining a neutral interest rate to contain inflation risks in the short term, keeping the policy rate unchanged at 2.25%. As the rate divergence between both central banks widens, Canadian-dollar-denominated fixed-income instruments remain more attractive, while those denominated in U.S. dollars become less appealing as U.S. yields decline. This dynamic could encourage capital inflows into Canada and reduce demand for U.S. dollars, since a stable rate in Canada supports stronger foreign demand for CAD, whereas increasingly lower rates in the United States reduce appetite for USD investments and weaken the currency’s demand.
Thus, if a neutral stance from the Bank of Canada is confirmed alongside a rate cut from the Federal Reserve, the combination could act as a key catalyst, maintaining the Canadian dollar’s strength and generating continued selling pressure on USD/CAD in the coming sessions.
USD/CAD Technical Outlook

Source: StoneX, Tradingview
- Uptrend at Risk: Since mid-June of this year, the bullish structure in USD/CAD had managed to sustain a relevant buying bias, forming a consistent uptrend line through the second half of the year. However, recent bearish movements have begun to jeopardize this structure, as the price has crossed below both the 50-period and 200-period moving averages, signaling an increasingly dominant bearish tone competing directly with the uptrend. If selling pressure continues in the sessions ahead, this could result in a definitive break of the uptrend and shift the pair toward a bearish bias into the final weeks of 2025.
- RSI: The RSI line maintains a steady downward slope and remains below the 50 neutral level, indicating that the average bearish momentum over the past 14 sessions confirms the presence of a significant short-term selling bias. However, the indicator is approaching the 30 level, associated with oversold conditions. If the RSI dips into this zone, it may signal an excess of selling pressure, opening the door for short-term bullish corrections.
- MACD: A similar scenario is reflected in the MACD, as its histogram continues to oscillate below the zero line, demonstrating a consistent bearish bias in the short-term moving averages. If the histogram continues to fall, selling pressure could intensify in the sessions ahead.
Key Levels:
- 1.39123 – Key Resistance: This is the nearest resistance level and aligns with the 200-period moving average. A sustained break above it could revive the uptrend line and generate temporary buying pressure.
- 1.38407 – Current Barrier: This level represents the most important indecision zone of recent weeks and coincides with the 50% Fibonacci retracement. Failure to break above it could result in the formation of a short-term sideways range.
- 1.37706 – Crucial Support: This level marks the lows aligned with the 61.8% Fibonacci retracement, representing the most relevant support on the chart. A break below it would confirm the end of the uptrend and open the door to a new bearish trend in the short term.
Written by Julian Pineda, CFA, CMT – Market Analyst
Follow him at: @julianpineda25