According to Al Jazeera, only three commodity vessels crossed the Strait of Hormuz yesterday, marking the lowest daily transit count since May. Many ships have either halted or reversed course following recent Iranian attacks on commercial vessels and the renewed U.S. blockade on Iran-linked shipping.
Investors are now closely monitoring whether these disruptions persist. While strategic reserves helped cushion supply shocks during the first half of the year, the second half could prove more challenging. Prolonged disruptions would have broader implications for inflation, bond yields, central bank rate expectations, and key technical levels across commodity markets.
I discuss these developments in my daily MENA Market Call.
Crude Oil Price Outlook: Dailyly Time Frame (Log Scale)
Source: TradingView
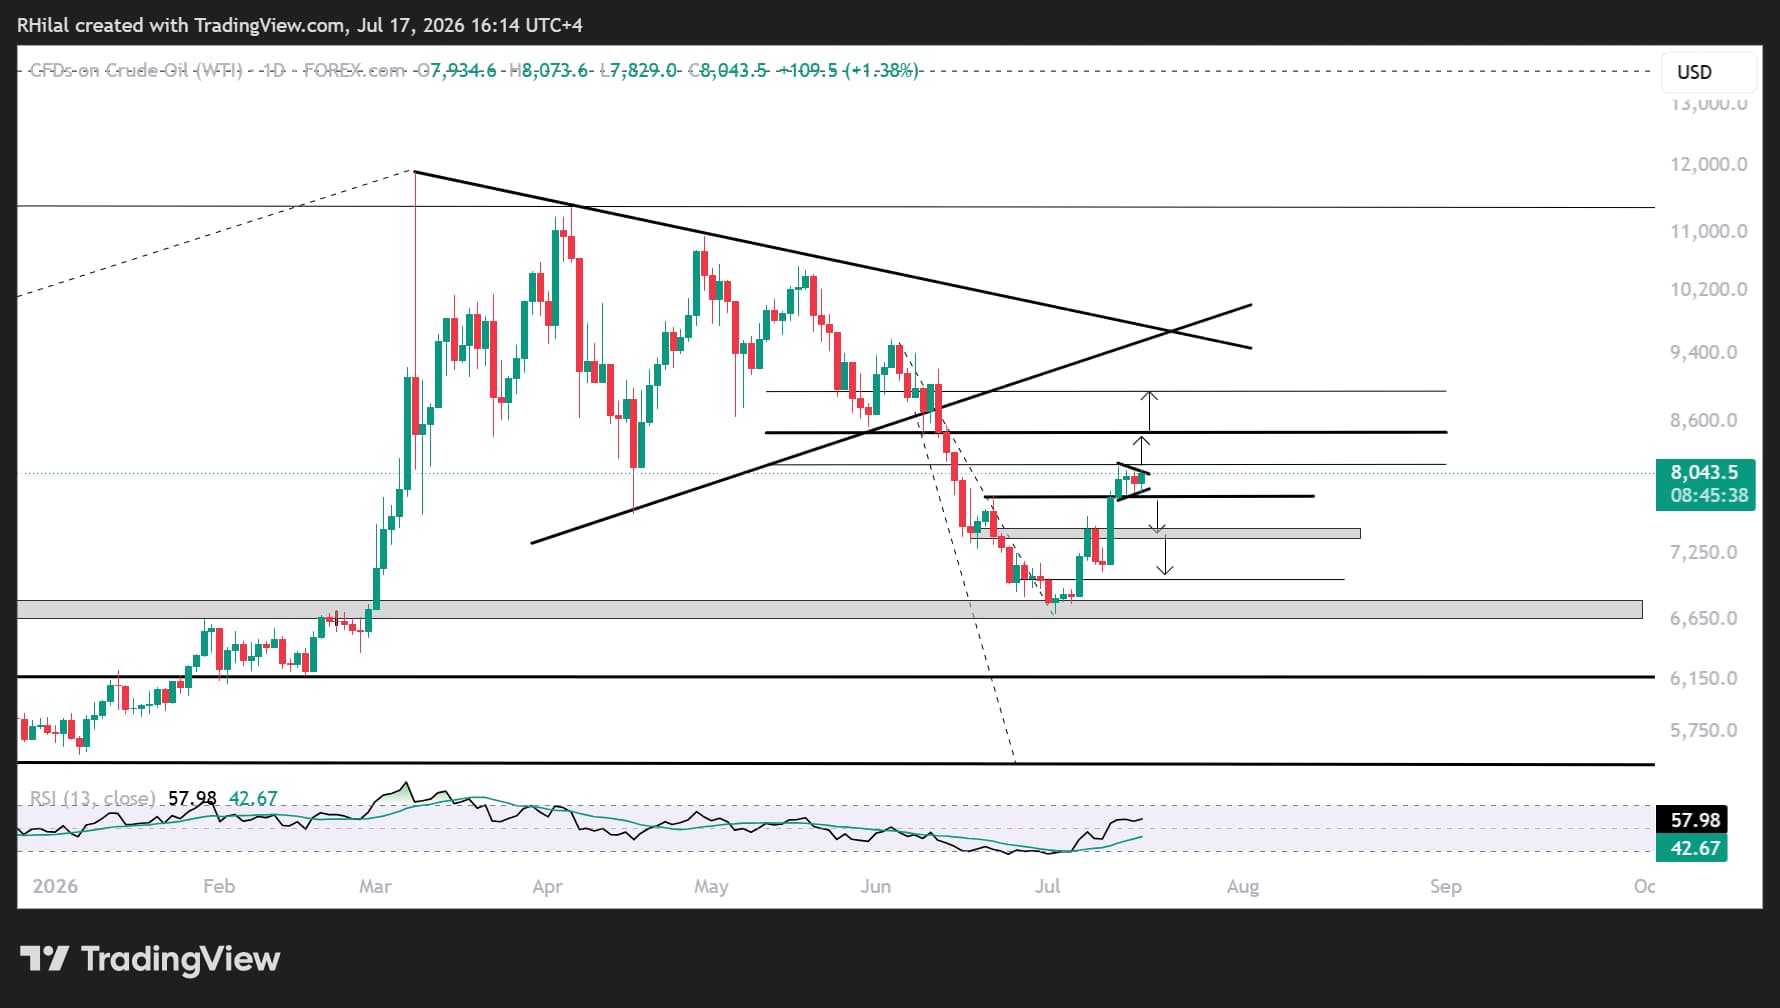
WTI crude oil has rebounded nearly 20% from the $66 support area, with the recovery stalling just below $81.50, near the 50% Fibonacci retracement of the June–July decline.
Price action has since entered a short consolidation phase, and its ability to hold above recent gains suggests upside risks remain intact should supply disruptions intensify and shipping through the Strait of Hormuz remain constrained.
Key resistance levels
If crude oil breaks above $81.50, the following levels become key:
- $84.80–$85.00: 61.8% Fibonacci retracement, representing a high-probability resistance zone.
- $89.80: 78.6% Fibonacci retracement, a major barrier that would determine whether prices can resume the broader uptrend toward the yearly highs.
Downside risks
Failure to hold above $78, followed by breaks below $73.50 and $70, would expose $68 and $66.50 once again.
This remains a major technical support zone, aligning with:
- Multi-year support dating back to 2019.
- The 78.6% Fibonacci retracement of the 2026 rally.
Although the recent rebound interrupted downside momentum, the broader bearish trend remains intact following the breakdown below the March–June consolidation range.
Should $66 fail to hold, downside pressure could initially extend toward $61, while a decisive break below that level would reinforce the case for a move toward the $55 objective outlined in my second-half outlook.
While oversold conditions triggered a short-term recovery, developments surrounding the Strait of Hormuz will likely determine whether the rebound extends or whether the broader oversupply narrative re-emerges later this year.
Gold Price Outlook: 6-Month Time Frame (Log Scale)
Source: TradingView
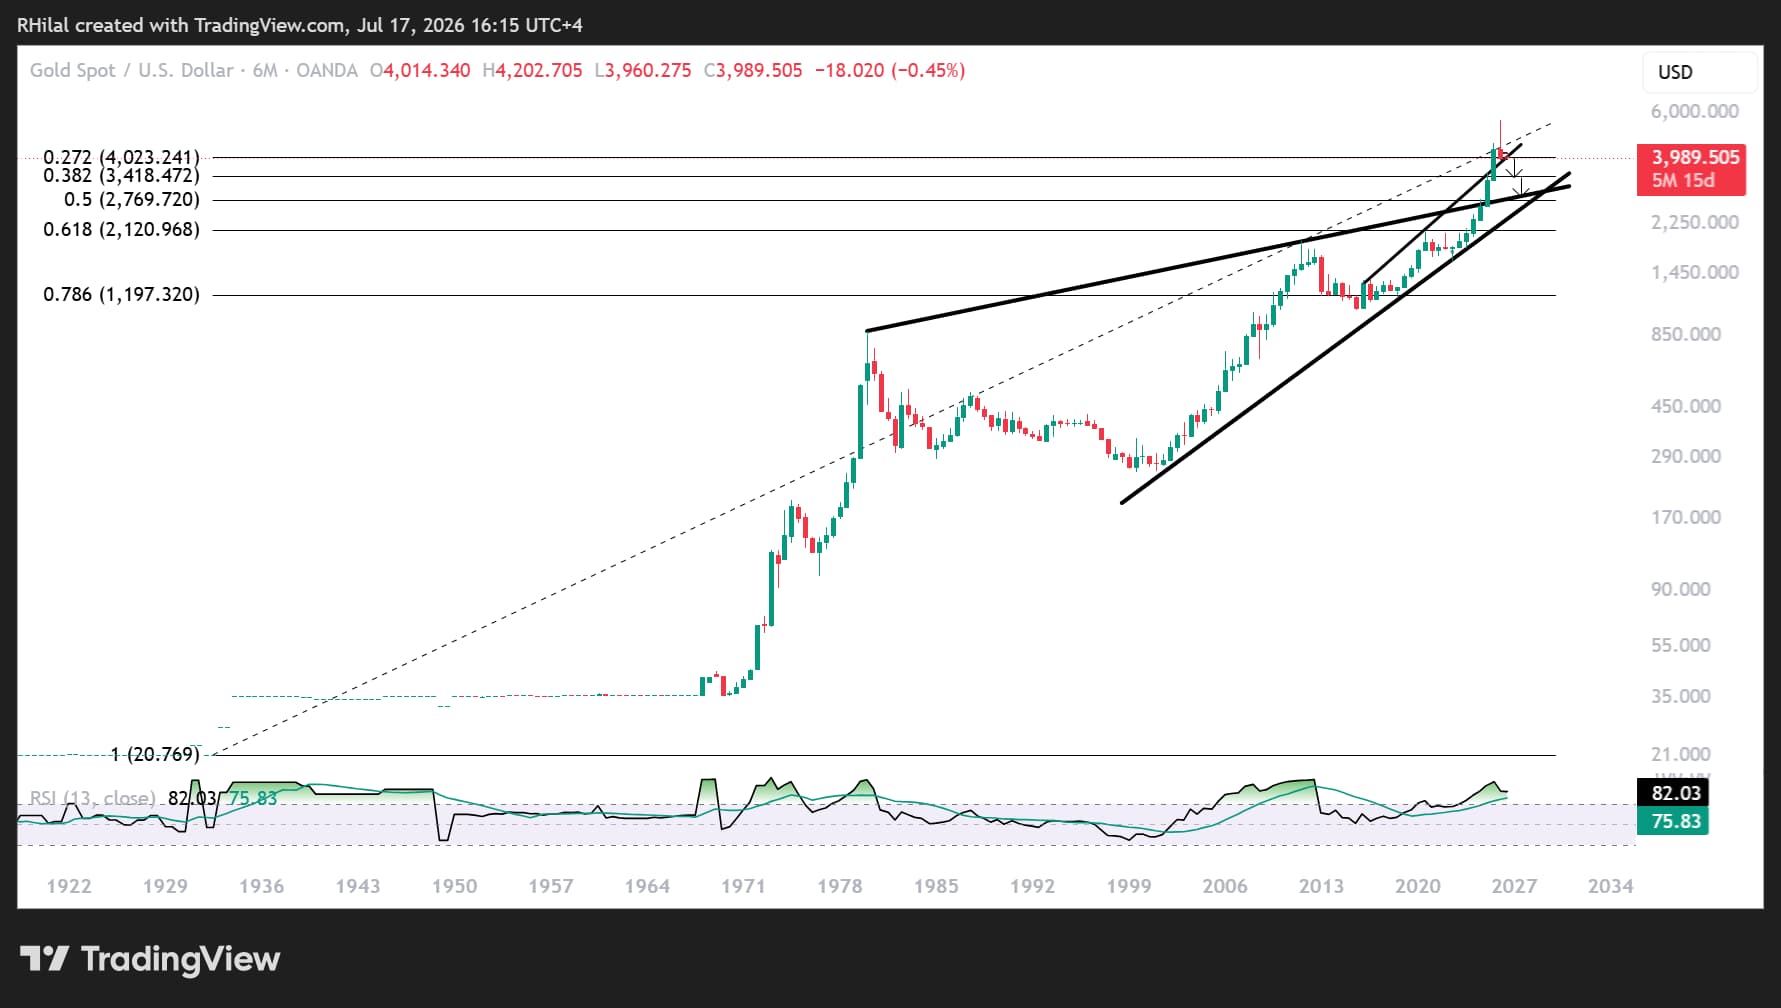
From a six-month perspective, gold is testing one of its most significant historical confluence zones.
- Price is attempting to break below the 27.2% Fibonacci retracement of the 1920–2026 secular advance. A close below 3,930 would expose the 38.2% Fibonacci retracement around 3,500–3,460, a zone that acted as a major resistance area throughout much of 2025.
- Gold is also testing the long-term trendline connecting the major highs between 2016 and 2025. This former resistance trendline has now become a key long-term support level, reinforcing the importance of the current technical confluence.
Whether gold rebounds from this area or extends its correction will likely depend on developments in crude oil and, more importantly, the evolving U.S.-Iran-Hormuz situation. A sustained geopolitical resolution could help stabilize inflation expectations, bond yields, and overall market sentiment, supporting a recovery in precious metals. Conversely, a prolonged escalation would likely reinforce inflation concerns, keep yields elevated, strengthen the U.S. dollar, and increase downside risks for gold.
The shorter-term and longer term upside scenario is illustrated in the following chart.

Gold Price Outlook: Daily Time Frame (Log Scale)
Source: TradingView
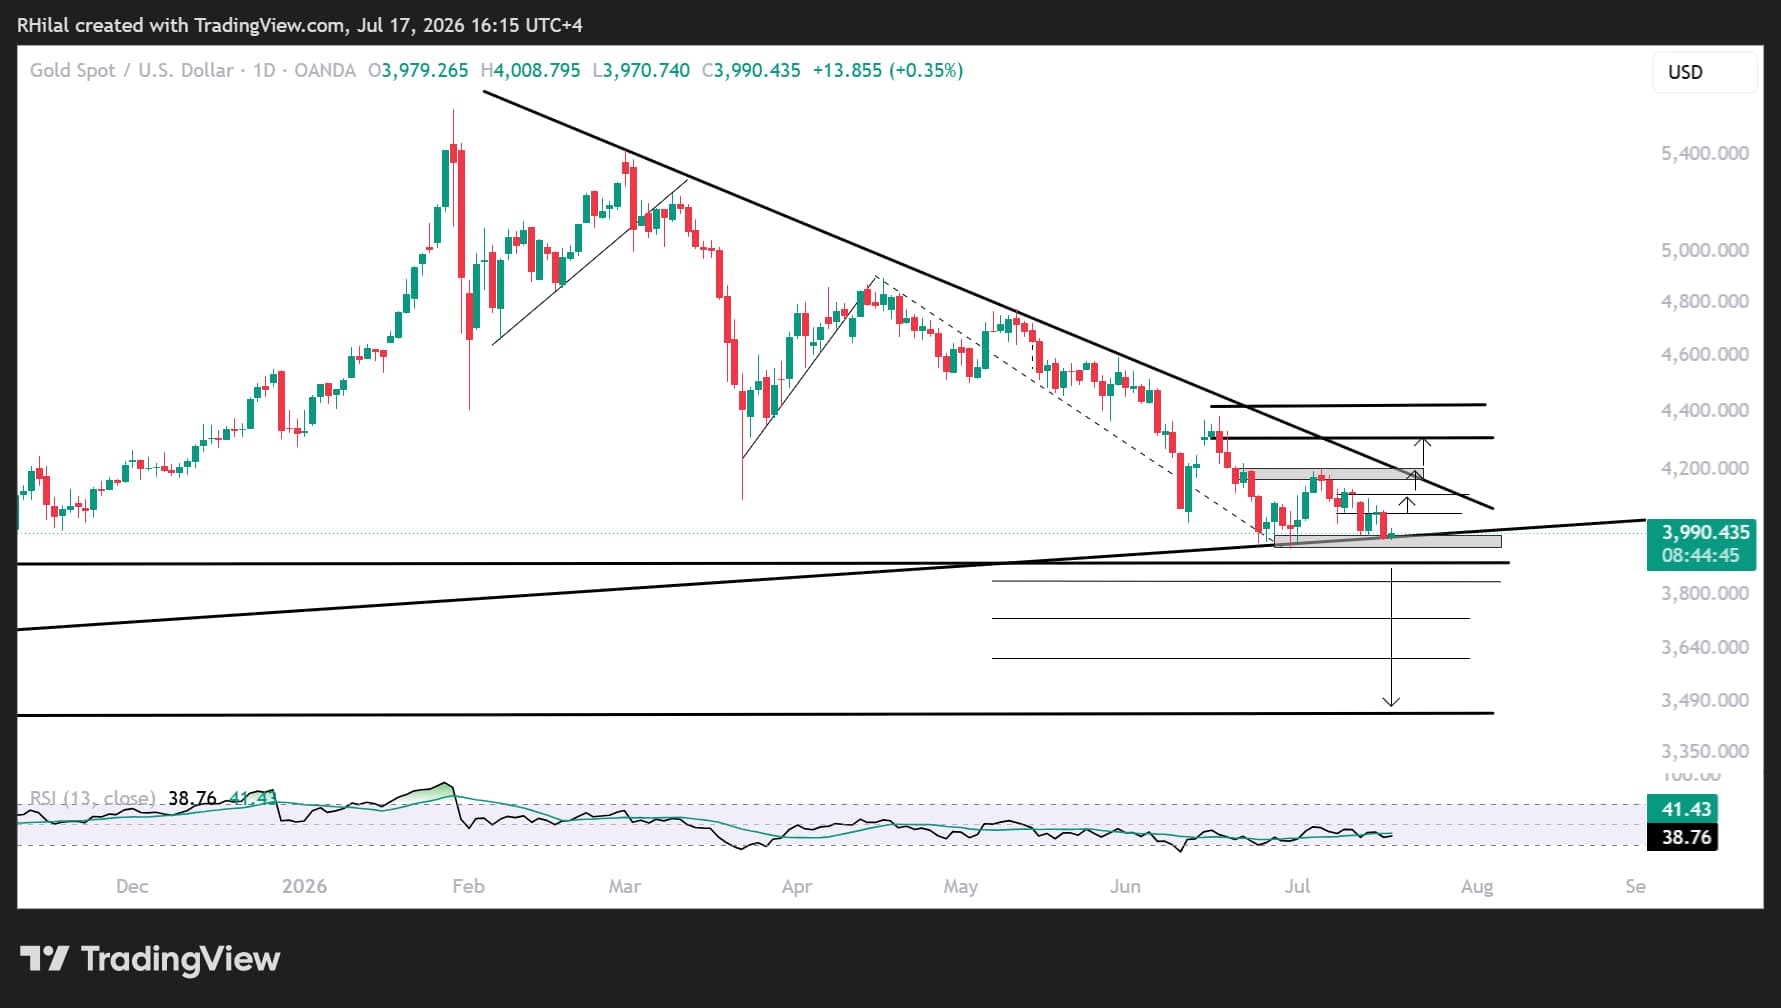
Despite the strong high-time-frame support zone, gold continues to trade below the descending trendline connecting the lower highs since March 2026, leaving the broader short-term bias bearish.
The current rebound remains fragile while testing the 27.2% Fibonacci retracement of the April-July decline.
A sustained recovery above 4040, 4,120 and 4,200 would shift attention toward:
- 4,300: 38.2% Fibonacci retracement.
- 4,420: 50% Fibonacci retracement, a level that would signal a more meaningful shift back toward a bullish trend.
As long as the U.S. Dollar Index (DXY) and crude oil remain firm, downside risks across currencies and precious metals are likely to remain elevated, with geopolitical developments continuing to shape the broader macro outlook.
Written by Razan Hilal, CMT
Follow on X: @Rh_waves