
Crude oil remains the market’s dominant narrative despite conflicting headline signals.
WTI and Brent crude have pulled back from key confluence zones and resistance levels, raising questions about whether a top has formed or whether another rally is ahead.
Both charts continue to hold above the July 2026 highs despite their latest pullback from resistance levels near $108 and $103. This keeps both escalation and de-escalation scenarios in focus.
Key developments include:
- Brent crude has pulled back from 7-month support turned into resistance, the 78.6% Fibonacci retracement level of the March - July decline, and overbought momentum conditions last seen in March 2026.
- U.S. 10-year Treasury yields have pulled back slightly below the psychological 5% mark, in line with daily overbought momentum conditions last seen in May 2026, before a 2-month consolidation phase.
- The latest U.S. CPI data delivered mixed signals. From a year-over-year perspective, core CPI eased from 2.5% to 2.4%, while headline CPI remained stable at 3.4%. From a monthly perspective, headline CPI rose from 0.1% to 0.4%, while core CPI increased by 0.3%.
Despite the stable to bullish inflation signals, crude oil’s price direction remains the dominant market narrative. The key question is whether the current pullback represents a short-term correction within a broader bullish trend or the beginning of a larger reversal.
Brent Crude Oil: Weekly Time Frame — Log Scale
Source: TradingView
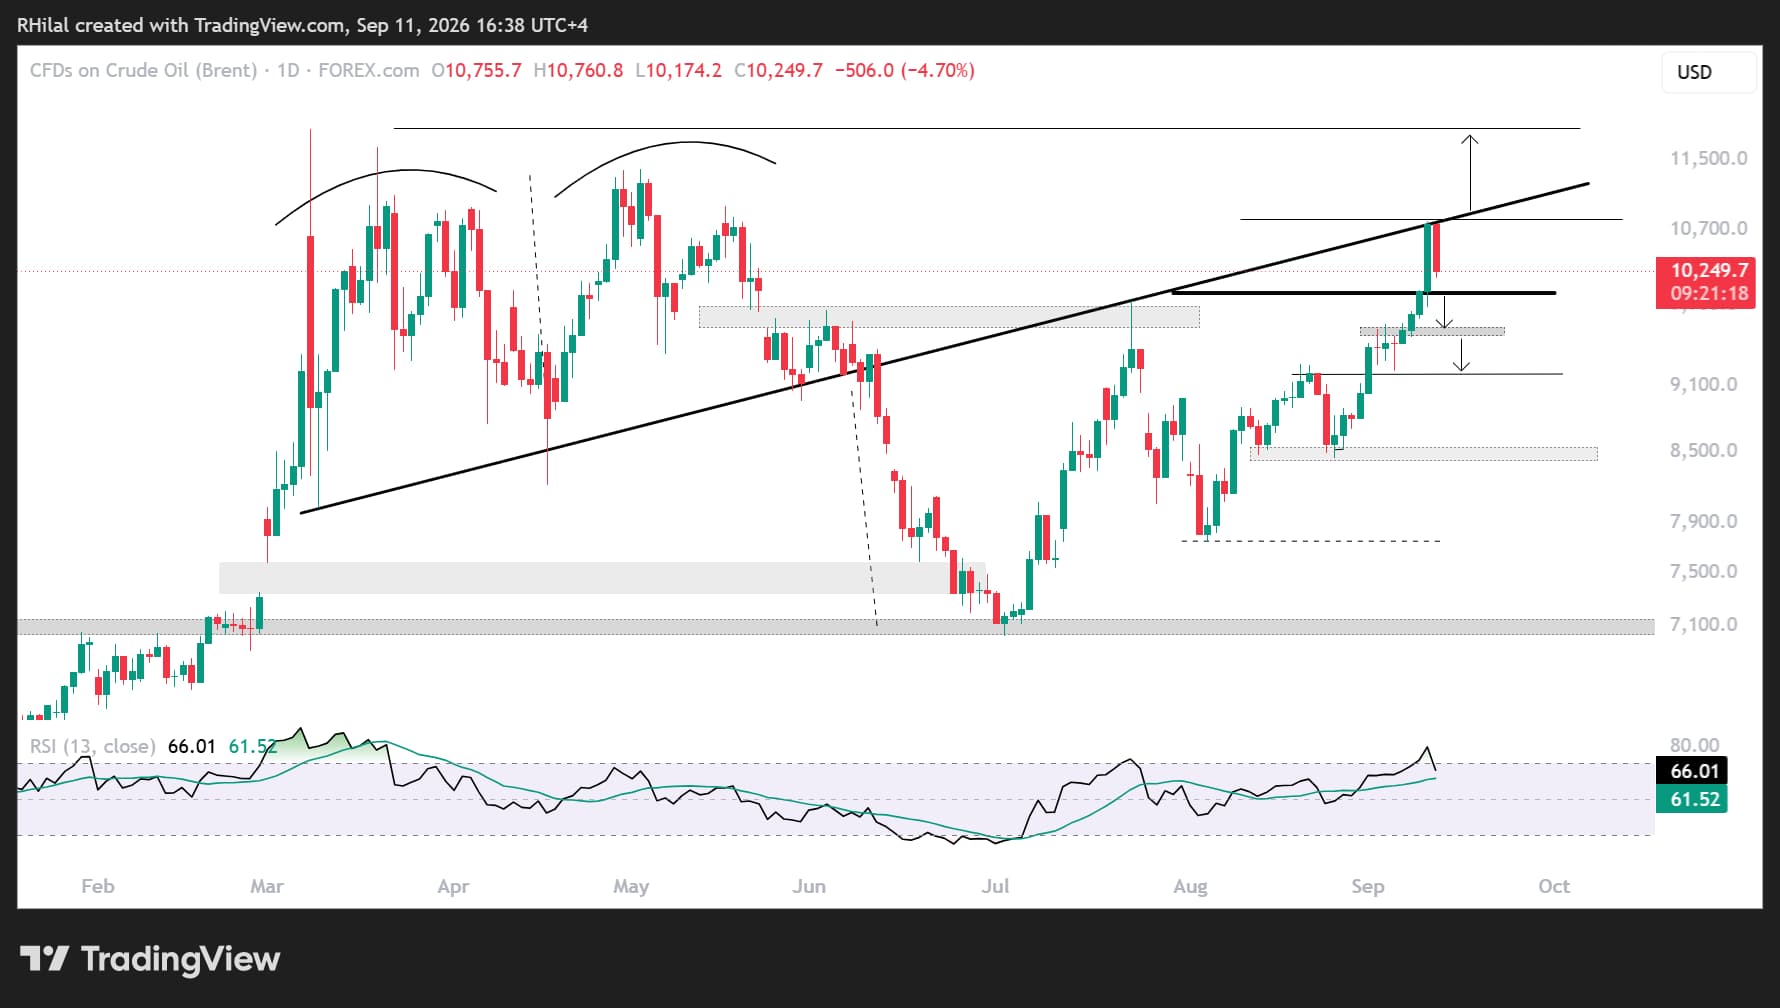
From a technical perspective, Brent crude reached a major confluence zone, increasing the possibility that a short-term top may have formed.
The confluence zone includes:
- The 7-month trendline that served as support between March and June 2026 before turning into resistance between July and September 2026.
- The 78.6% Fibonacci retracement of the March–July 2026 downtrend near $108.
- Overbought momentum conditions last seen in March, close to the yearly highs.
The pullback was expected given the steepness of the rally and the importance of this confluence zone.
Bullish scenario: Reclaiming the $108 mark would restore the longer-term bullish outlook and reinforce inflationary and geopolitical escalation risks. Such a move could redirect Brent toward the yearly highs.
Bearish scenario: A move back below the July 2026 high near $99 would support a short-term de-escalation narrative. The next downside levels would be $96, $93 and $89, corresponding to Fibonacci retracement levels of the advance between August 26 and September 11.
WTI Crude Oil: Daily Time Frame — Log Scale
Source: TradingView
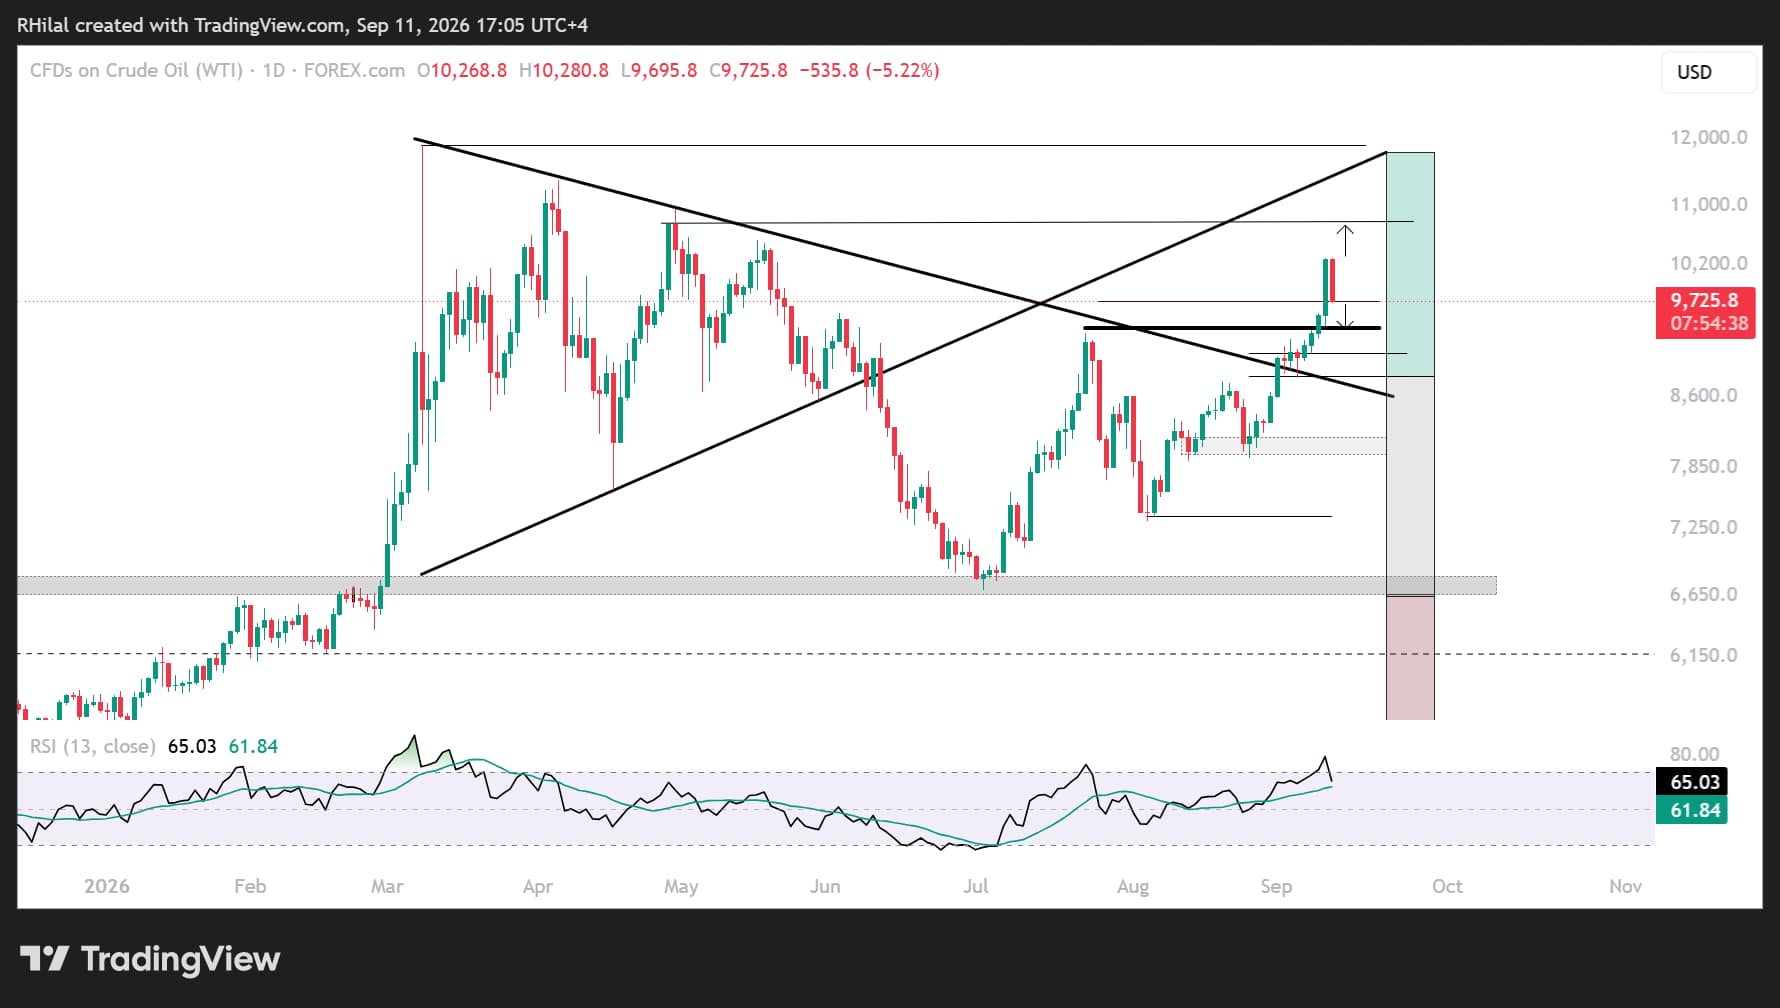
For WTI, the 7-month resistance level that has capped lower highs since March 2026 remains the main barometer for the bullish and bearish bias.
This resistance aligns with the July 2026 high near $94.
A breakdown below this level could support a short-term drawdown toward the 7-month trendline near $88 before confirming a broader de-escalation narrative.
The $88 area also aligns with the 61.8% Fibonacci retracement of the August–September advance, making it another major confluence zone to monitor.
Bullish scenario: A daily close above $103 would redirect WTI toward $108, which also represents the 78.6% Fibonacci retracement of the March–July downtrend. A sustained move above this area would reinforce the potential for another rally toward the yearly highs.
Overall, bullish risks remain elevated as long as crude oil prices hold above the July 2026 highs. The current oil-market structure continues to interact with inflation data, Treasury yields and expectations for the Federal Reserve’s September policy decision.
A firmer-than-expected inflation outlook, Treasury yields near 5% and elevated Fed rate-hike expectations could continue to shape market sentiment through the oil, yield and inflation relationship.
However, the broader risk-off narrative could begin to reverse if crude oil breaks below its key support levels, Treasury yields extend their pullback and geopolitical tensions begin to ease towards the U.S mid-term elections.
Written by Razan Hilal, CMT
Follow on X: @Rh_waves