

A New Test for the Global Energy-Security System ?
The U.S.-Iran conflict has done more than disrupt oil flows. It has challenged many of the assumptions underpinning the global energy security system established after the 1973 oil embargo. With both the Strait of Hormuz and the Red Sea coming under pressure, the market is increasingly asking whether a new energy security regime, built around resilient supply chains, alternative transport routes, and geopolitical cooperation, will emerge from this crisis.
What the 1973 Oil Shock Changed
The 1973 oil embargo, a political response by Arab oil producers during the Yom Kippur War, transformed global energy markets. By curtailing production and restricting exports, oil-producing nations demonstrated that crude oil could be used as an effective geopolitical weapon. Oil prices quadrupled within months, triggering inflation, economic slowdowns, and a period of stagflation across much of the developed world.
The crisis prompted a sweeping overhaul of the global energy security framework. Strategic petroleum reserves (SPRs) were established to provide emergency supplies during disruptions, the International Energy Agency (IEA) was created to coordinate energy policy among consuming nations, and oil market stability increasingly relied on the influence of OPEC, spare production capacity, and broader energy cooperation.
The Architecture Built After 1973
For more than five decades, these mechanisms helped cushion supply shocks. Emergency reserves could be released into the market when needed, while OPEC's spare capacity acted as a stabilizing force during periods of disruption.
However, the 2026 energy crisis presents a fundamentally different challenge.
Why 2026 Is Different
The current disruption is not primarily driven by a shortage of oil production capacity, but by constraints on transportation and logistics. The Iranian blockade and military tensions surrounding the Strait of Hormuz, through which roughly one-fifth of global oil flows typically pass, have exposed the vulnerability of one of the world's most important energy chokepoints. The situation has become even more complex with threats to Saudi Arabia's East-West Pipeline, which was widely viewed as a critical alternative route for bypassing Hormuz.
In such an environment, additional barrels from strategic reserves or higher production quotas cannot fully address the problem if the infrastructure and shipping lanes needed to transport those barrels remain constrained.
This raises a critical question for investors and policymakers alike: are the institutions and policies designed after 1973 sufficient for today's challenges, or is the world entering a new energy security era focused less on oil production and more on transportation resilience, infrastructure security, and geopolitical stability?
Tracing Parallels between the 1973 oil embargo and the 2026 Hormuz crisis
|
1973 oil shock |
2026 energy-security shock |
|
Leverage came from restricting oil production and exports. |
Leverage comes from disrupting transportation and maritime routes. |
|
The response focused on SPRs, the IEA, diversification, and OPEC coordination. |
The likely response may involve maritime security, alternative corridors, refined-product reserves, and regional agreements. |
|
The main risk was a shortage of crude oil. |
The main risk is restricted movement of crude and refined products. |
While there are lots of fundamental factors intertwined with the crude oil and energy market analysis and predictions, the timing of any significant change is still uncertain. However, the approach of the US mid term elections in line with the latest pullback in crude oil prices below a 7-month barrier could hint to potential near-term changes.
Q4 Fundamental Dashboard
|
Driver |
Current evidence |
Q4 implication |
|
Saudi Arabia and the Houthis |
Saudi Arabia has restarted the East–West Pipeline, but at reduced rates. Full capacity and resumed Yanbu loadings have not yet been fully confirmed, while renewed Houthi attacks continue to threaten regional infrastructure and shipping routes. |
Continued disruption supports Brent’s geopolitical premium; sustained restoration of Yanbu and pipeline flows would weaken it. |
|
Global supply and demand |
The IEA projects 2026 supply at 100.7 million barrels per day, down 5.7 million barrels per day year over year, while forecasting a 2.5 million-barrel-per-day decline in demand. OPEC expects modest demand growth of approximately 0.4 million barrels per day. |
Physical tightness is bullish, but demand destruction could limit the upside. |
|
Inventories |
U.S. commercial crude inventories are near 426 million barrels, while the EIA expects global inventories to remain under pressure through the end of 2026. |
Further draws would support breakouts; inventory rebuilding would reinforce reversal risks. |
|
Refined products |
U.S. distillate inventories are expected to remain below 100 million barrels and below the five-year seasonal range through year-end. |
The main Q4 shortage may be diesel and refined products rather than crude itself. |
|
Russia–Ukraine |
Russian refinery throughput fell to 3.8 million barrels per day in June, around 30% below the previous year. Gasoline output declined 20%, while diesel production fell nearly 30%. |
Tighter diesel markets and wider crack spreads may support refiners within XLE, even if crude corrects. |
|
SPR |
U.S. SPR holdings are near 285 million barrels, well below authorized capacity. |
Emergency releases can soften a short-term shock, but the strategic buffer is more limited than before. |
|
U.S. midterm elections |
Energy affordability, diesel prices, sanctions, SPR policy, and Iran diplomacy may become increasingly sensitive ahead of the November election. |
Policy headlines could temporarily amplify volatility and influence the geopolitical premium. |
The fundamental outlook therefore remains divided. The IEA is highlighting demand destruction, OPEC is projecting eventual demand resilience, and the EIA expects gradual supply normalization and lower prices over time. The Q4 market will depend on whether physical disruptions persist long enough to overwhelm the normalization scenario.
Technical Scenarios to Watch
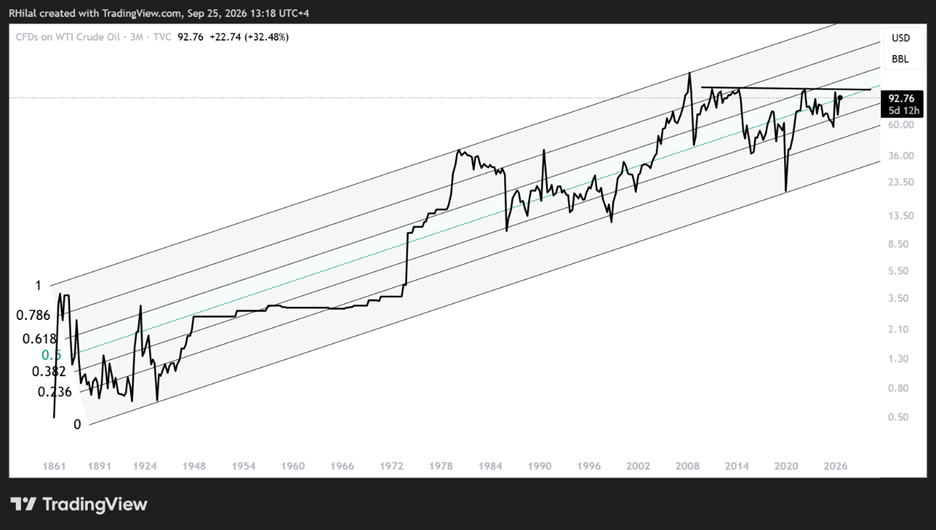
WTI Crude Oil Outlook: 3 – Month Time Frame – Log Scale
Source: Trading view
On the 3-month time frame, crude oil’s broader bullish structure provides the long-term context, with resistance near 120 separating a potential price-escalation scenario from another major drawdown.
This level connects the highs established since 2011. A sustained breakout above 120 would support a renewed long-term uptrend toward the upper boundary of the broader 1860–2026 channel, potentially shifting the wider energy-market framework.
On the downside, a sustainable pullback—particularly below pre-war levels—could extend crude oil’s consolidation toward the 60–50 range, easing broader inflationary pressures and stagflation concerns.
Weekly Structure: WTI and Brent
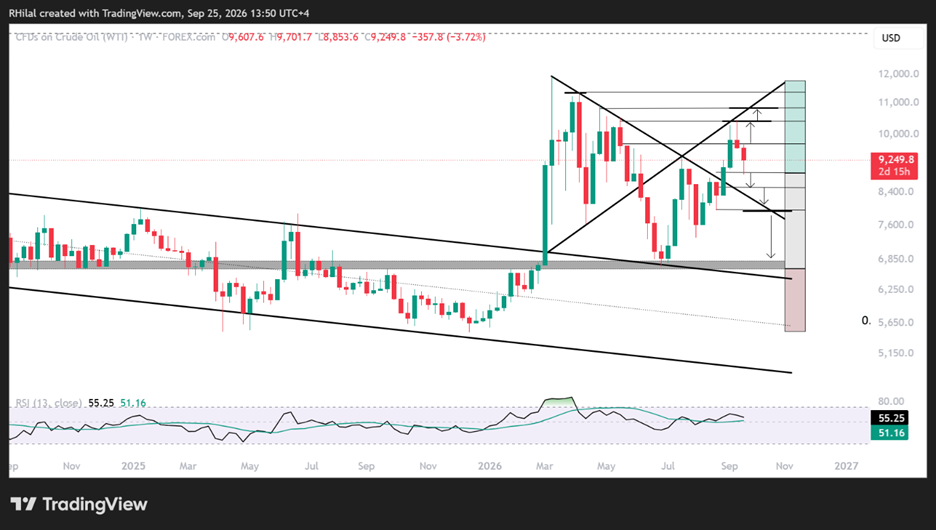
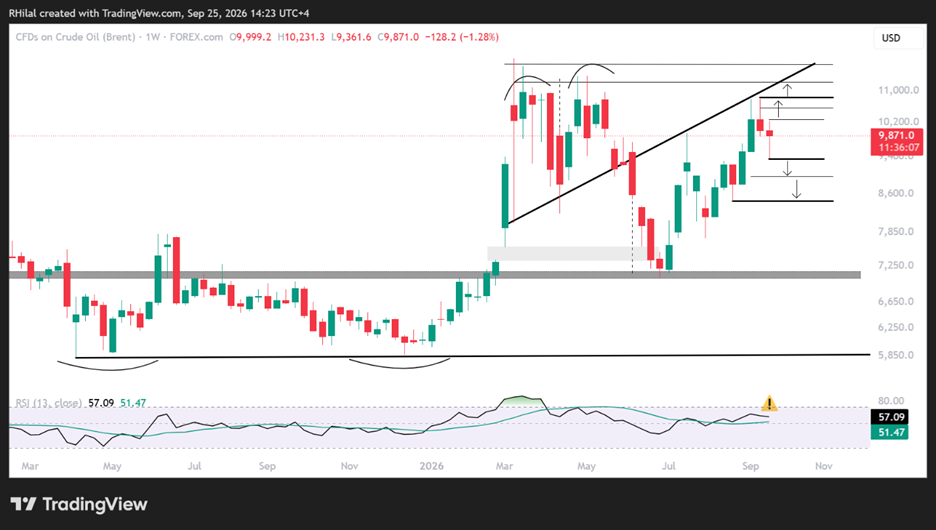
The weekly charts define tactical levels that may separate escalation from normalization.
|
Market |
Bullish confirmation |
Key support |
Bearish implication |
|
WTI |
97, then 104.50 and 108 |
88.50 |
Below 88.50 exposes 84.80 and 79.60 |
|
Brent |
100, then 108 |
93.60 |
Below 93.60 exposes 89.60 and 84.60 |
WTI Crude Oil Outlook: Weekly Time Frame – Log Scale
Source: Trading view
WTI’s latest pullback from the seven-month resistance barrier near 104.50, alongside overbought daily momentum conditions last seen in March, is reflecting near-term bearish reversal risks while testing a key support near the 88.50 mark.
This level aligns with the 61.8% Fibonacci retracement of the August 24–September 25 advance. A breakdown would confirm a short-term de-escalation scenario and expose the 78.6% and 100% retracement levels near 84.80 and 79.60 respectively. A sustained breakdown below the 79-mark would likely increase bearish risks back towards prewar levels, possibly in line with a longer term de-escalation narrative.
A close back above 97 would improve the short-term structure, while a breakout above 104.50 and 108 would support another escalation phase and a potential return toward the yearly highs and the 120 barrier.
Brent Crude Oil Outlook: Weekly Time Frame – Log Scale
Source: Trading view
Brent’s latest pullback from the seven-month resistance barrier near 108, alongside overbought daily momentum conditions last seen in March, is reflecting near-term bearish reversal risks while testing a key support near the 93.60 mark. The 93.60 level aligns with the 61.8% retracement of the August 24–September 25 advance. A breakdown would expose 89.60 and 84.60, increasing the probability of a deeper drawdown toward pre-war levels if supply routes continue to normalize.
A close above the psychological 100 level would restore short-term bullish momentum and escalation risks, while a breakout above 108 would confirm a stronger escalation scenario and support a return toward the yearly highs.
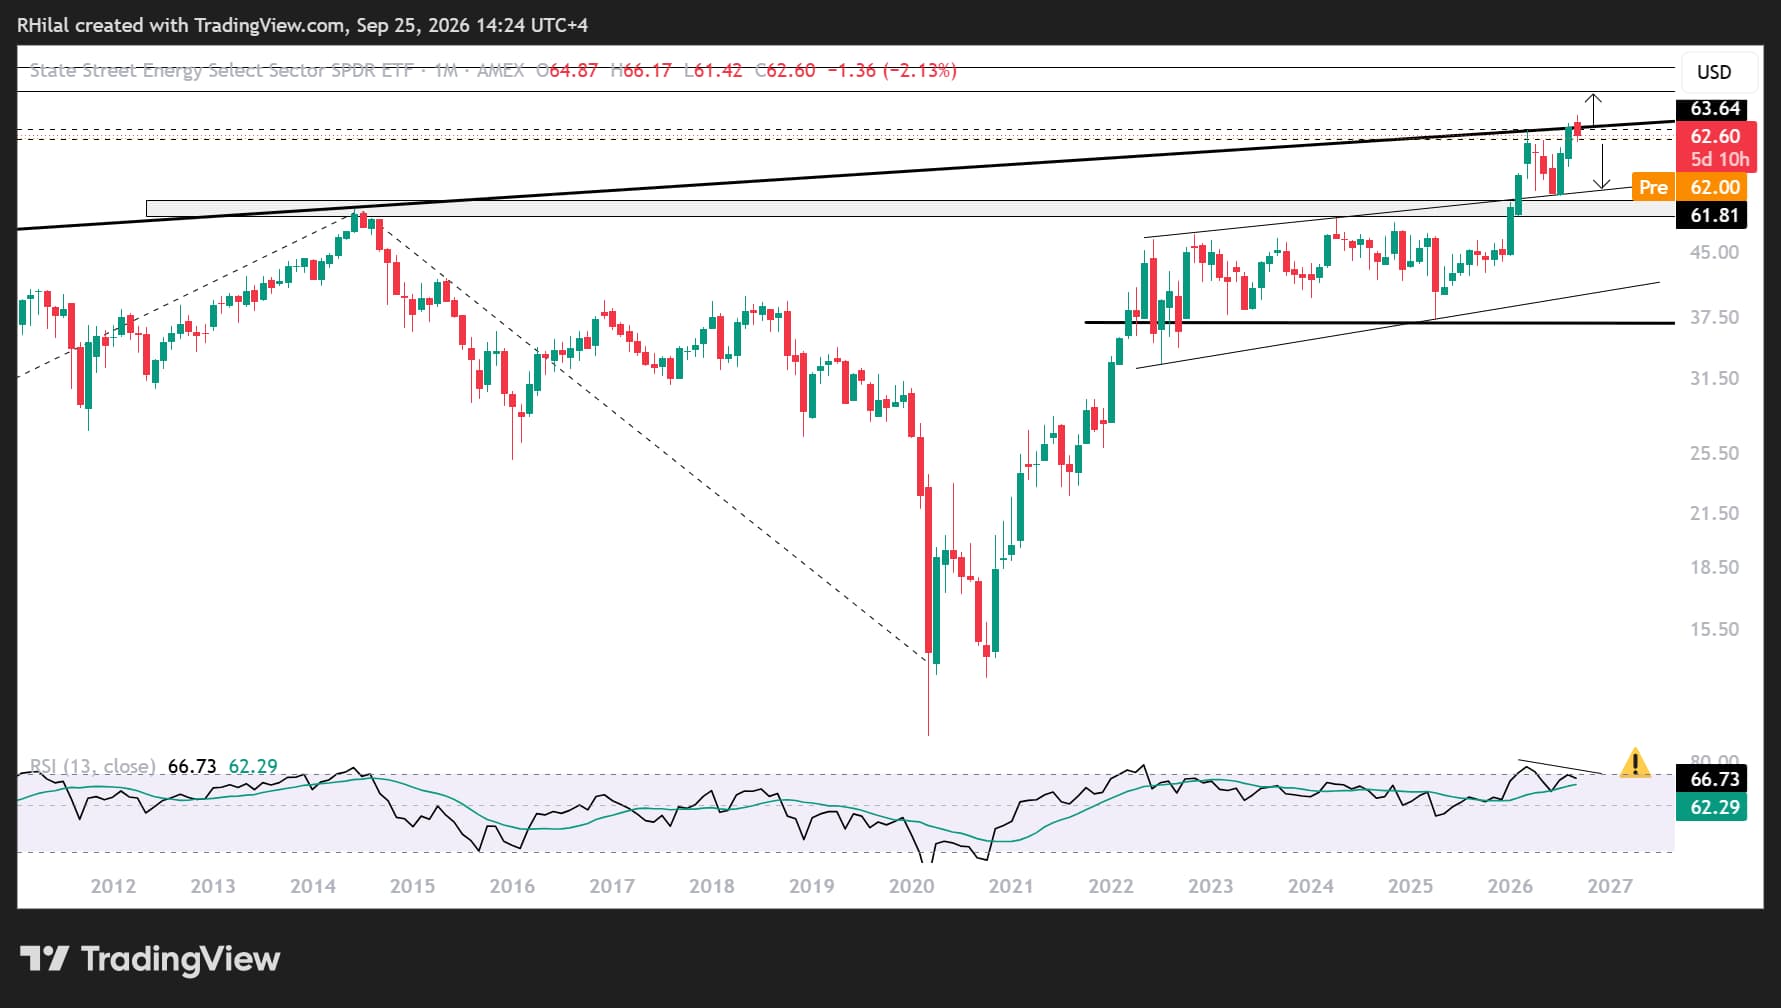
Cross-Market Confirmation: XLE Monthly Time Frame — Log Scale
Source: Trading view
Finally, the Energy Select Sector SPDR Fund (XLE) is testing its 18-year resistance breakout, which spans the period from 2008 to 2026. A bearish divergence on the monthly RSI also signals reversal risks, while momentum remains overbought at levels last seen in 2022. This makes the ETF an important confirmation signal for the broader energy-market thesis.
- A sustained close above 66 would support continued energy-sector strength.
- A breakdown below 61 would reinforce a bearish reversal.
- Crude rising while XLE weakens could signal exhaustion or doubts about the durability of energy-sector earnings.
- Crude falling while XLE holds above the long-term breakout could indicate continued support from refining margins and refined-product shortages.
A close back above the long-term breakout level would suggest that energy equities are continuing to price persistent supply risk, inflation pressure, and higher bond yields. Conversely, a sustained breakdown below 61 would support the normalization scenario.
Conclusion
Q4 2026 is shaping up as a test between energy-security disruption and supply-chain normalization. The physical market remains vulnerable as Hormuz, the Red Sea, Saudi export routes, and Russian refining capacity face continued pressure. However, weaker demand expectations, potential inventory rebuilding, and the gradual restoration of alternative supply routes could limit crude’s upside.
The technical framework provides the clearest way to assess which scenario is gaining control. A move above 97 for WTI and 100 for Brent would support renewed bullish momentum, while breakouts above 104.50 and 108 would strengthen the escalation scenario. XLE holding above 66 would provide additional equity-market confirmation.
Conversely, breaks below 88.50 for WTI, 93.60 for Brent, and 61 for XLE would suggest that normalization, weaker demand, and easing geopolitical risk are outweighing the supply premium.
The central question is whether the 2026 crisis produces lasting changes to the global energy-security regime or remains a severe but temporary disruption.
Written by Razan Hilal, CMT
Follow on X: @Rh_waves






