U.S.–Iran negotiations may be moving closer to a breakthrough as the U.S. midterm elections approach on Tuesday, bringing key resistance levels on crude oil charts into focus.
Despite the stalemate outcome following the Israeli elections, the chances of a diplomatic breakthrough may be improving following intensified mediation efforts by Qatar and regional allies. Reports point to discussions about sanctions relief and reopening the Strait of Hormuz, while nuclear restrictions and inspections remain major unresolved issues.
With crude oil approaching key resistance levels while precious metals and equities test important support, reversal risks may be building. The scenarios below outline the levels I’m watching.
I cover these charts in my weekly webinar, held every Tuesday.
For more than eight months, headlines have swung between negotiation efforts and escalation risks. As the U.S. midterm elections approach and worldwide economic pressure and inflation concerns widen, a near-term agreement may be possible.
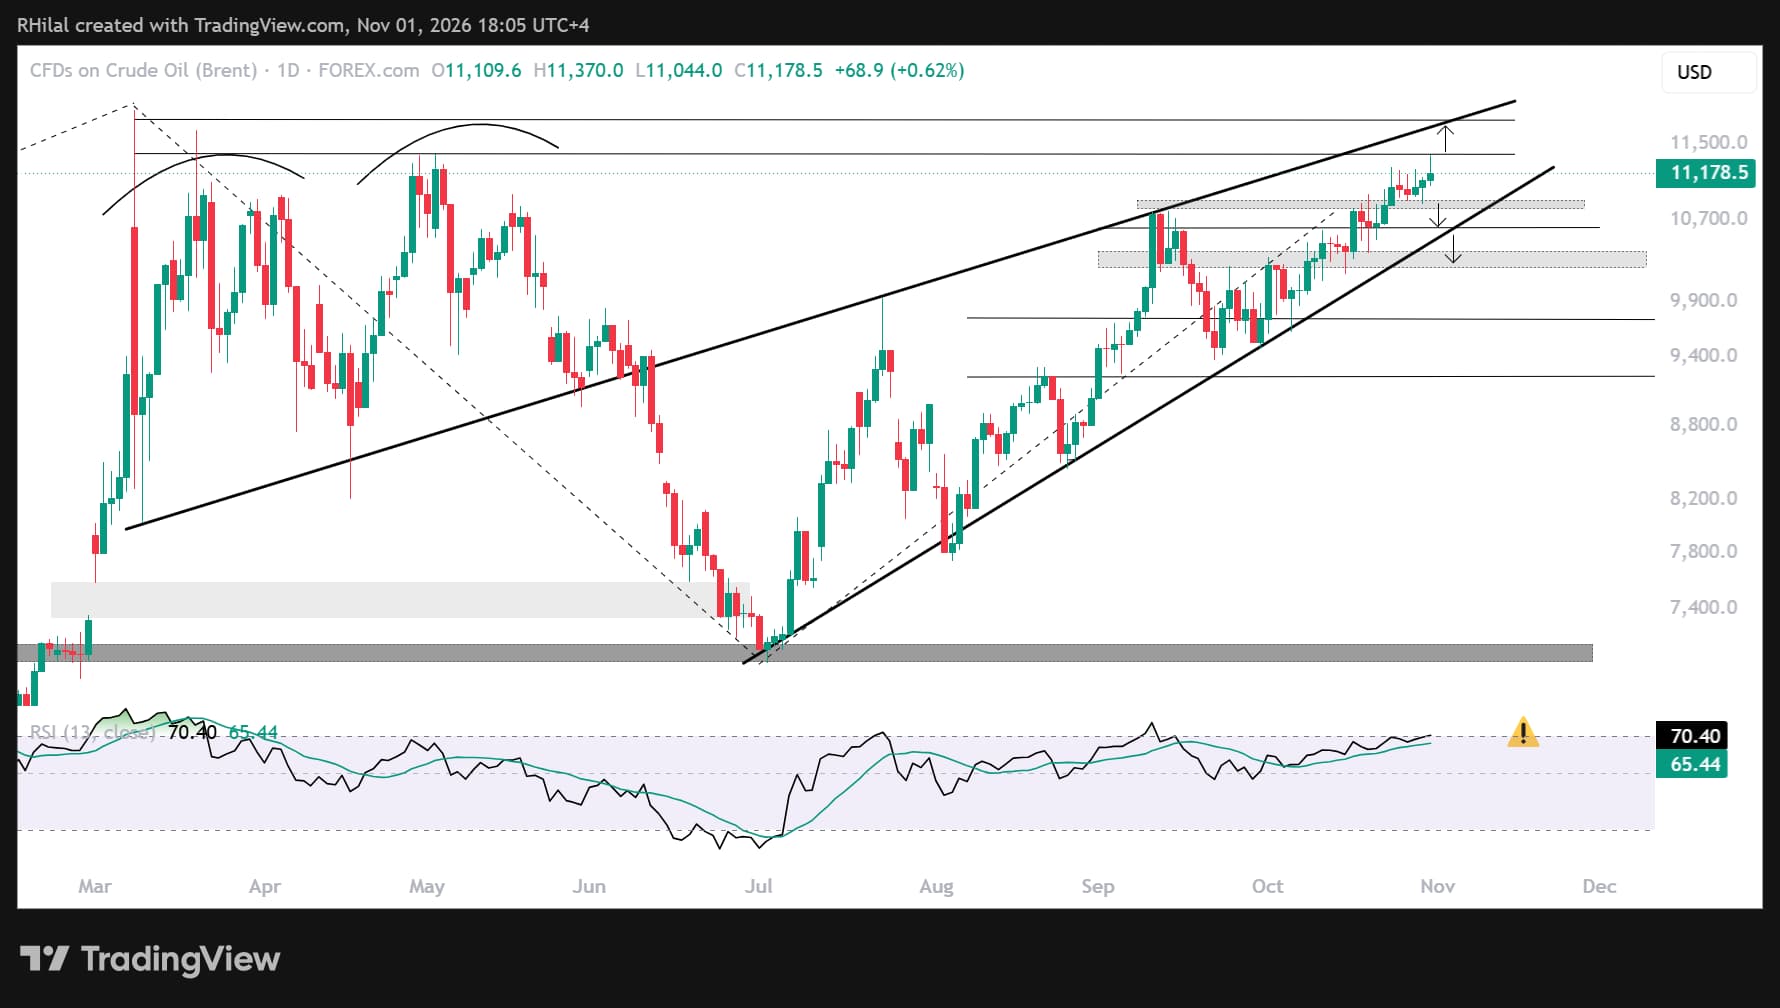
Brent Outlook: Daily Time Frame – Log Scale
Source: TradingView
On the daily chart, Brent is facing a technical confluence zone between $113.70 and $118, where a pullback could emerge. This zone aligns with the 2026 highs, an uptrend respected since March 2026, and daily RSI overbought conditions last seen in September, July and March—periods that preceded notable bearish reversals on the chart.
If this confluence holds and a bearish reversal develops, the key support levels I’m watching are near $108, $106 and $102. These levels align with the rising support established since July 2026. A break below $102 would invalidate this support structure and increase the risk of a steeper drawdown, potentially alongside an unwind in the geopolitical risk premium.
On the upside, a close above $118 would signal the potential for a longer-term bullish rally and deeper stress for markets.
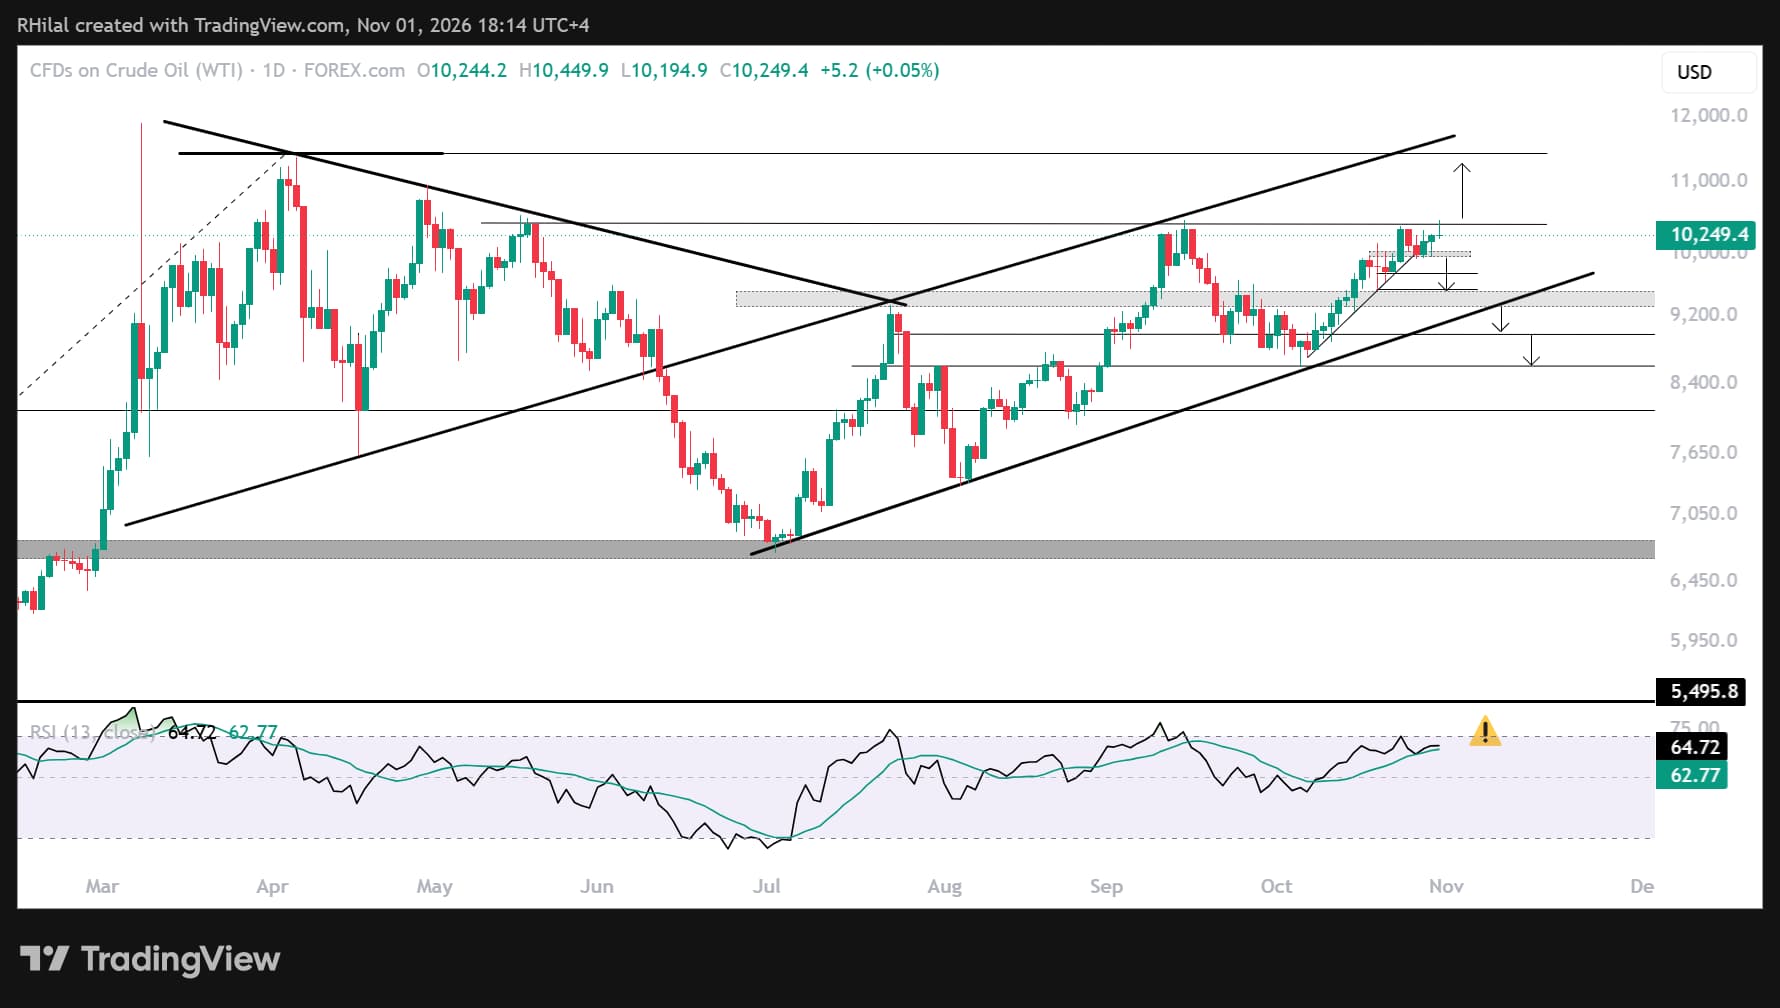
WTI Crude Oil Outlook: Daily Time Frame – Log Scale
Source: TradingView
WTI has pulled back from the $105 barrier three consecutive times, establishing a strong ceiling for price action. This level aligns with the 61.8% extension of the April 2025–March 2026–July 2026 price cycle.
A sustained close above $105 would bring the yearly highs and the trendline respected since March 2026 into focus, with potential resistance near $114. The yearly highs also align with a barrier respected since 2011. A sustained break above this zone would increase the risk of longer-term bullish continuation.
On the downside, I’m watching rising support near $99.50, connecting higher lows across October. A break below this level would be the first bearish signal, bringing the rising support established since July 2026—near $95 and $93—into focus. A move through those levels would increase the risk of a deeper corrective phase, potentially alongside a U.S.–Iran breakthrough.
For more than eight months, headlines have shifted between negotiations and escalation. With the U.S. midterm elections on Tuesday, November 3, and diplomatic efforts continuing, both geopolitical developments and the technical levels above are likely to shape crude oil’s next move.
Written by Razan Hilal, CMT
Follow on X: @Rh_waves