
At the start of the second week of April, financial markets have begun to show a recovery in short-term confidence and risk appetite, which is already being reflected in the price action of major cryptocurrencies. These assets have managed to close the week in positive territory and reach levels not seen in several weeks.
Bitcoin, as the market’s benchmark asset, has once again held above the $70,000 level, signaling that confidence has started to restore demand strength in the market. If this dynamic continues, buying pressure could remain relevant in the coming sessions.

Performance of major cryptocurrencies
Source: Data - StoneX, Tradingview
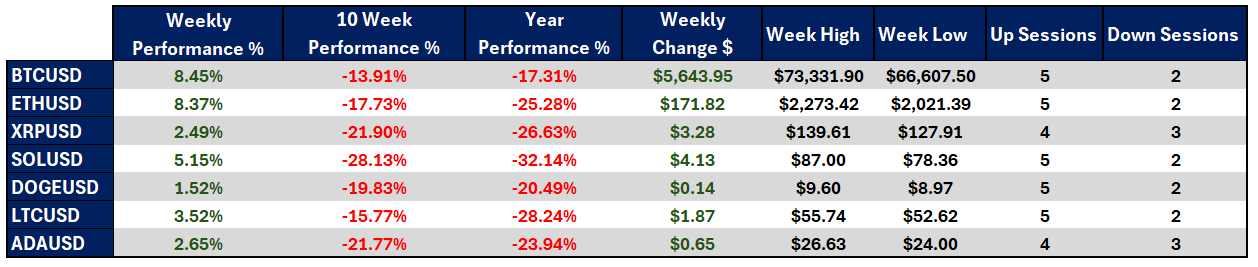
- Bitcoin has posted the strongest performance of the week, gaining +8.45%, positioning itself as the asset that has recovered the most in the short term. On the other hand, Dogecoin shows the smallest gain at +1.52%, although it also reflects an improvement compared to previous weeks. Overall, the market has closed with consistent positive movements, confirming a recovery in short-term confidence.
- When analyzing the past ten weeks, the crypto market still trades below previous closing levels, indicating that the recent recovery is not yet strong enough to eliminate the medium-term bearish bias. Solana remains the most affected asset with a decline of -28.13%, while Bitcoin shows greater resilience with a variation of -13.91%, highlighting its relative stability.
- A similar dynamic is observed year-to-date, where all major cryptocurrencies continue to trade below their opening levels. Solana leads losses with -32.14%, while Bitcoin shows a decline of -17.31%, reinforcing its role as the most stable asset within the market.
- Bitcoin has also experienced an increase in volatility, with weekly price swings exceeding $5,000 and reaching highs near $73,000, suggesting that it has managed to hold above key psychological levels. This supports the view of a short-term recovery gaining traction.
- Overall, the week has been positive for the crypto market, although strength has been concentrated mainly in large-cap assets such as Bitcoin and Ethereum, while smaller assets show more moderate gains. This suggests that confidence is recovering, but not uniformly across the entire market.
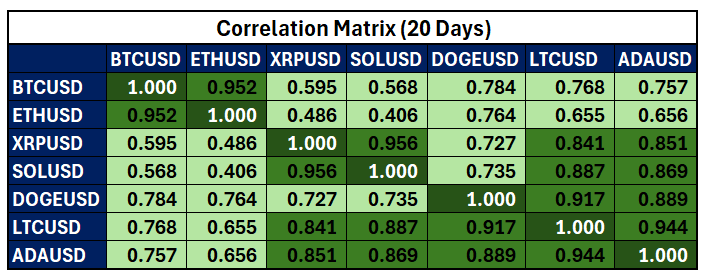
Colors from red to green – Red for negative correlations and green for positive correlations
Source: Data - StoneX, Tradingview
From a correlation perspective, there has been a decline in the positive correlation between cryptocurrencies and Bitcoin. In some cases, the coefficient has moved closer to 0.5, indicating that while the relationship remains positive, its strength has weakened. It is important to note that correlation levels can change over time.
This behavior suggests that the market has not been sufficiently uniform to consistently replicate Bitcoin’s price movements, with strength concentrated mainly in the leading asset. As this dynamic continues, Bitcoin may continue to lead the market without fully dragging the rest of the assets higher.
Overall, the market is showing a positive short-term structure, but with a concentration of demand in specific assets, suggesting that upward movements may persist but in a more selective manner during the short term.
Bitcoin approaches a key technical zone
Source: StoneX, Tradingview
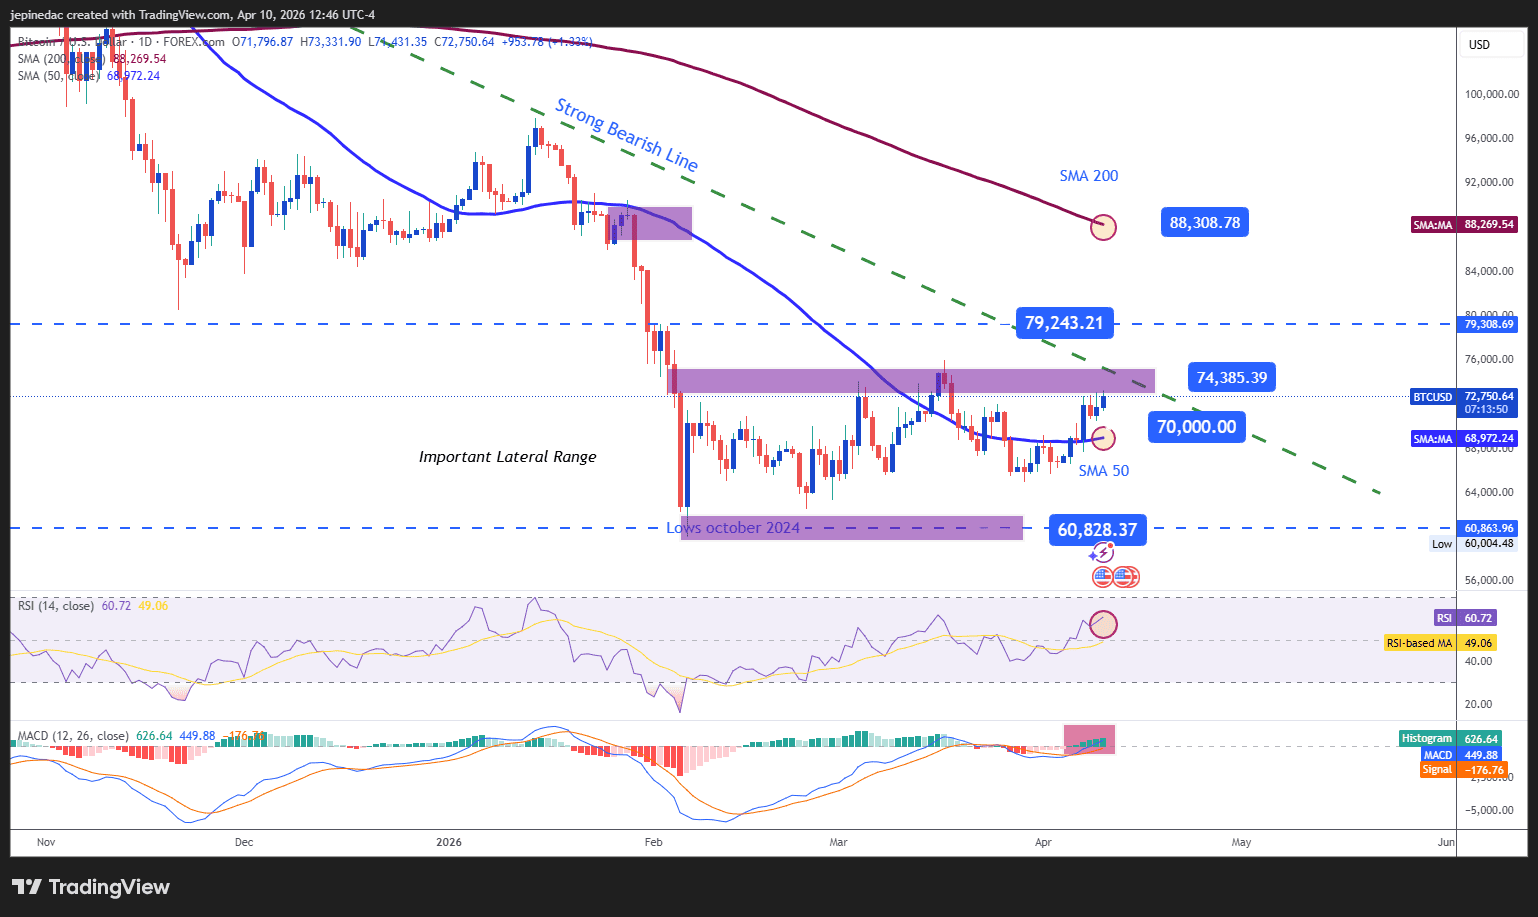
The recent rebound in Bitcoin has become particularly relevant from a technical perspective, as price action is approaching a break of both a sideways range and a downtrend line that has dominated the past few months. If buying pressure remains consistent, this could lead to a structural shift in the chart, favoring a more sustained bullish bias in the short term.
Indicators:
- Both the RSI and MACD remain above their neutral levels (50 and 0, respectively), indicating that buying momentum is gaining strength. As long as this behavior continues, buying pressure is likely to remain dominant in the short term.
Key levels:
- $74,380 – Key resistance: A level that aligns with recent highs, the upper boundary of the recent range, and the primary downtrend line. A sustained move above this level could end the sideways phase and the longer-term bearish bias, opening the door to a more dominant bullish move and potentially a new short-term uptrend.
- $70,000 – Near-term barrier: A key psychological and neutral level aligned with the 50-period moving average. Price action around this level could continue to support the range-bound structure seen in recent weeks.
- $60,800 – Key support: A level not seen since October 2024. A sustained break below this zone could reactivate the bearish trend and bring selling pressure back into focus.
Solana shows a more limited recovery
Source: StoneX, Tradingview
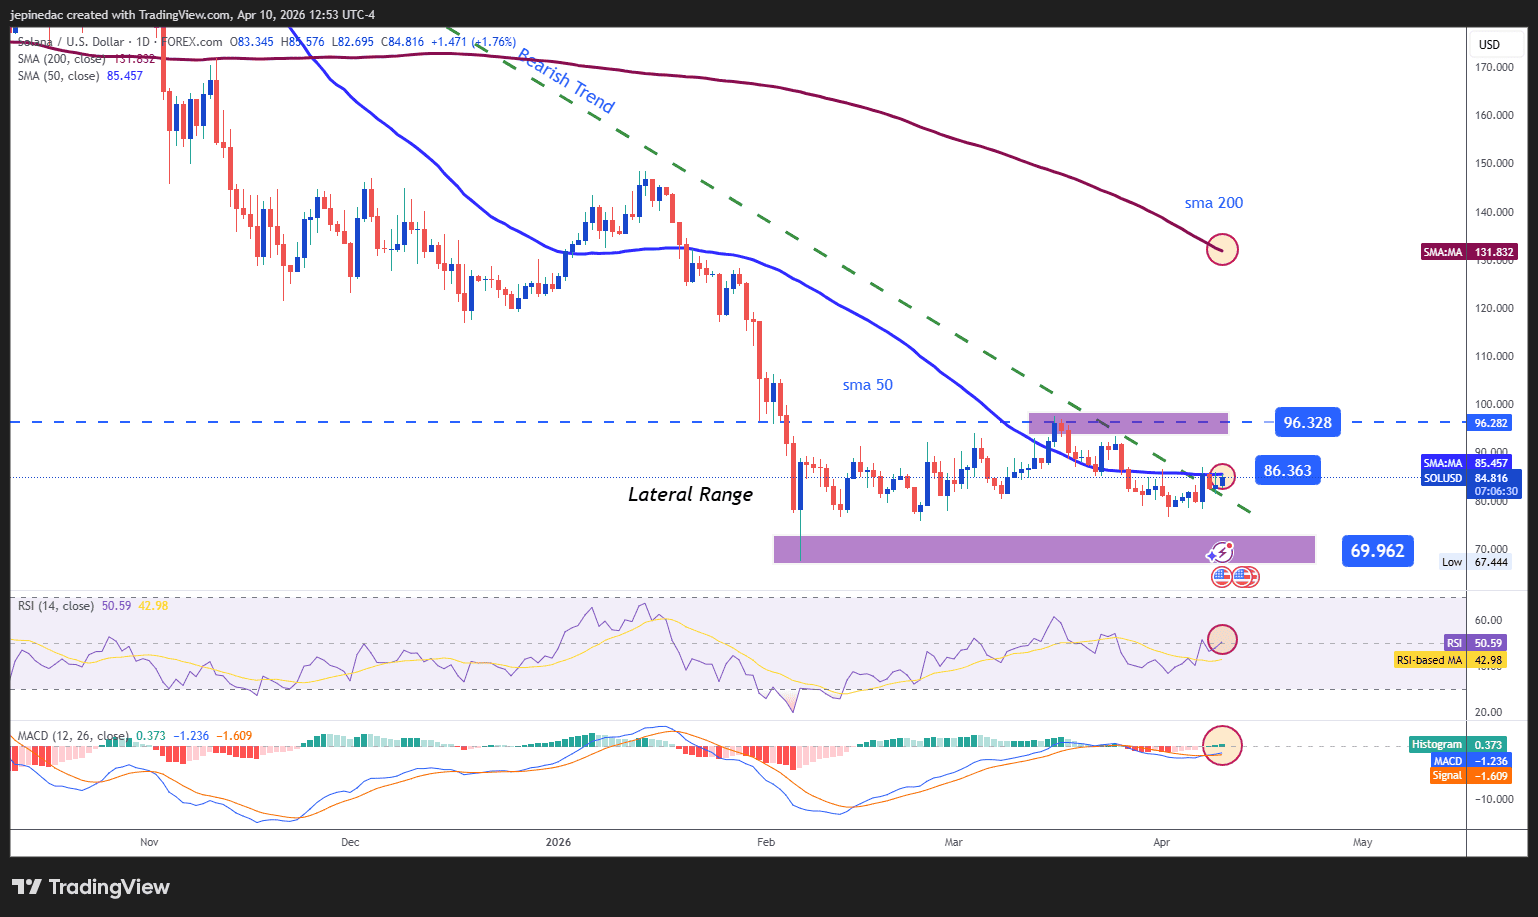
Although Solana closed the week in positive territory, it remains one of the assets showing the greatest degree of neutrality in recent price action. The recovery has not been strong enough to break the sideways range between 96.32 and 69.96, leaving indecision as the dominant theme in the chart.
Indicators:
- Both RSI and MACD remain close to their neutral levels, reflecting a balance between buying and selling forces. As long as this persists, sideways conditions are likely to remain the dominant scenario.
Key levels:
- 96.32 – Key resistance: The upper boundary of the current range. A break above this level could lead to the formation of a more relevant bullish bias in the coming sessions.
- 86.36 – Near-term barrier: A neutral level aligned with the 50-period moving average. Price action around this area could continue to reflect market neutrality and extend the sideways range.
- 69.96 – Key support: A level aligned with recent lows. A move back toward this area could bring renewed attention to the long-term downtrend line that has been in place for months.
Written by Julian Pineda, CFA, CMT – Market Analyst
Follow him on: @julianpineda25