Wall Street delivered a split performance after weaker-than-expected US jobs data, with the Dow Jones extending its record-breaking run while the Nasdaq 100 fell sharply as semiconductor and AI stocks remained under pressure. The ASX 200 staged an encouraging reversal on Thursday, but nearby options resistance and technical barriers suggest traders may need to brace for a choppy finish to the week.
View related analysis:
- AUD/USD Outlook 2026: Key Drivers for the Australian Dollar in Q3
- USD/JPY Caught Between NFP, the Fed and MOF Intervention Risk
- USD/CAD Eyes Pullback as CAD/JPY Decouples from Crude Oil, AUD/CAD Stabilises
- FX Futures Positioning: GBP Shorts Hit Records as USD Rally Slows | COT Report
- Australian Dollar Outlook: AUD/USD Shows Early Signs of a Swing Low
Dow Jones Leads While ASX 200 Tests Key Resistance
Dow Leads as Wall Street Rotation Hits Tech
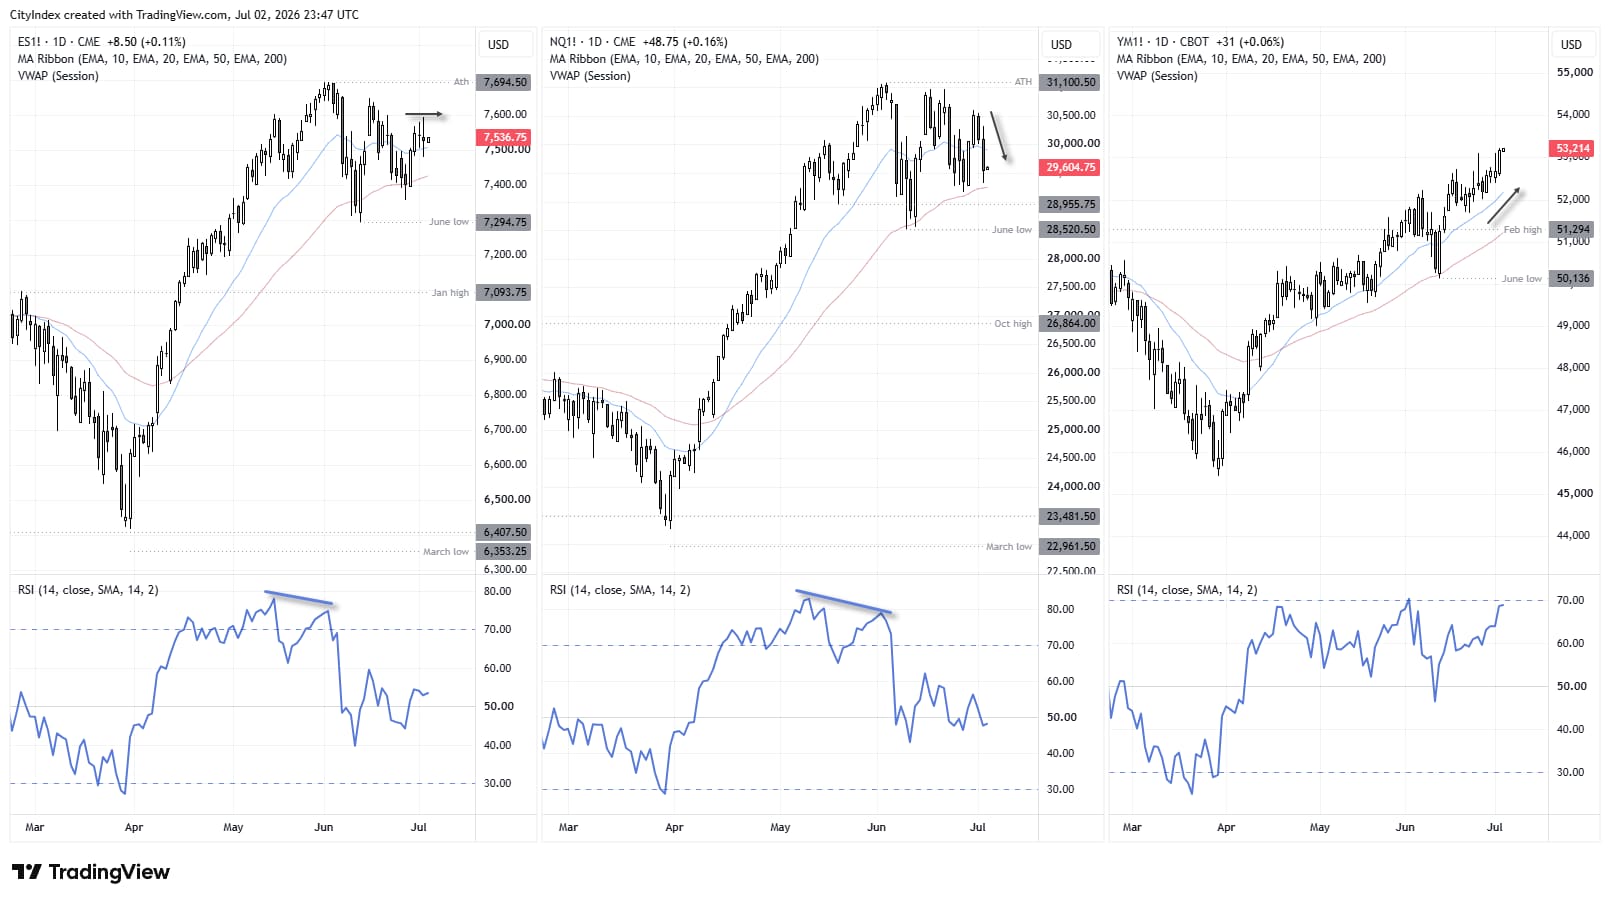
Wall Street moved in three separate ways on Thursday following a weaker-than-expected nonfarm payrolls (NFP) report. The Dow Jones reached a record high, rising more than 1% during its best session in nearly three weeks and posting its fifth consecutive bullish candle. The Nasdaq 100 fell 1.6% to a three-day low, while the S&P 500 finished little changed.
The Dow benefited from falling Treasury yields and a rotation into value, defensive sectors and mega-cap industrials. In contrast, the Nasdaq 100 came under pressure as its heavy exposure to semiconductor and AI stocks left it vulnerable to the ongoing technology sell-off, overwhelming any support from lower bond yields. Meanwhile, the S&P 500 was caught between the two, with broad-based gains across most sectors offset by weakness in its largest technology constituents.
Source: CME, CBOT, TradingView
Dow Jones Futures (YM) Technical Analysis
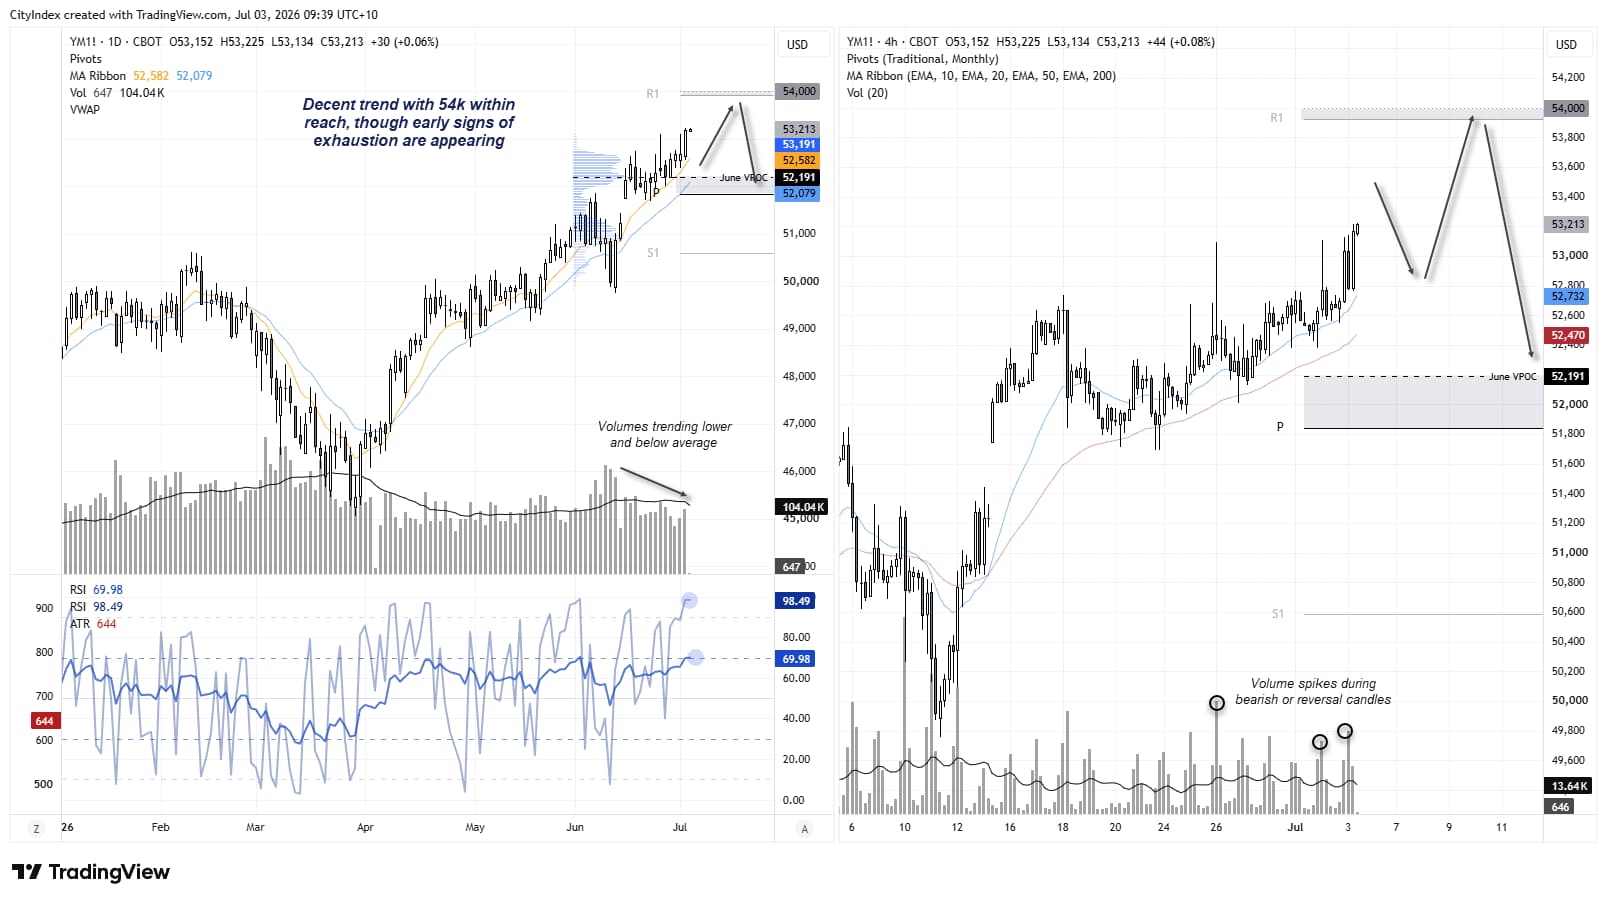
The daily chart shows a steady uptrend in Dow Jones futures that is neither excessive nor overstretched. Thursday's bullish range expansion day saw price rebound from the 10-day EMA and close above 53,000, with the monthly R1 pivot and the 54,000 handle sitting roughly one day's average true range (ATR) of 632 points above. While this does not guarantee the Dow Jones will reach that area within a single session, it suggests the move is well within the market's historical volatility range over the past 14 trading days.

Potential Dow Jones Support Around 52,000
Note that June's volume point of control (VPOC) sits near the 20-day EMA, just above the monthly pivot point, providing a potential support zone around 52,000.
With the daily RSI (2) at an extremely overbought reading of 98.36, bulls may need to tread carefully. However, given the strength of the uptrend, nearby support levels, and Wall Street traders' preference for the Dow over the Nasdaq and S&P 500, any pullbacks may continue to attract buyers.
Source: ICE, TradingView
ASX 200 (XJO), SPI 200 (AP1) Technical Analysis
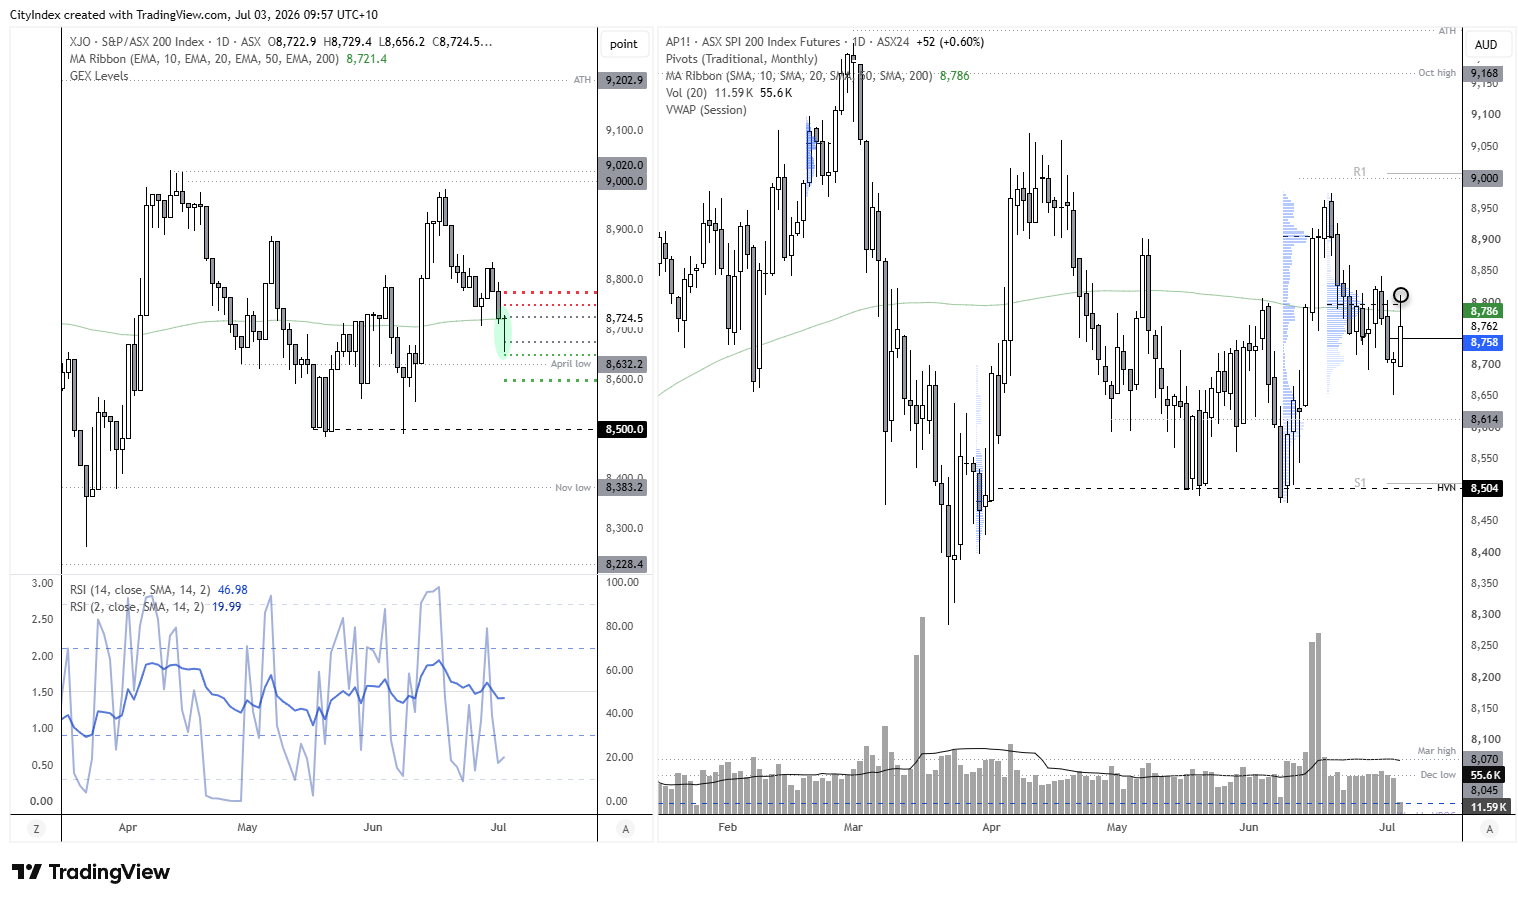
Thursday was initially off to a poor start, with the ASX tumbling beneath its 200-day EMA. Yet those losses were fully reversed for an effectively flat close, leaving a bullish pinbar around its 200-day average. The fact the bullish reversal occurred above the April low and the 8650 put cluster adds weight to the case for a swing low, although that does not necessarily mean it will be plain sailing for bulls from here.
The options market also points to resistance overhead. The largest call open interest sits at 8750 and 8775, creating a nearby gamma ceiling where rallies could stall unless buyers can secure a convincing break above it. For now, the 8650 put cluster provides the first line of support on any pullback.
The rebound on SPI 200 futures overnight also met resistance at its own 200-day EMA, reinforcing the importance of the 8750–8775 region heading into Friday.
Source: ICE, TradingView
ASX 200 1-Hour Chart Analysis
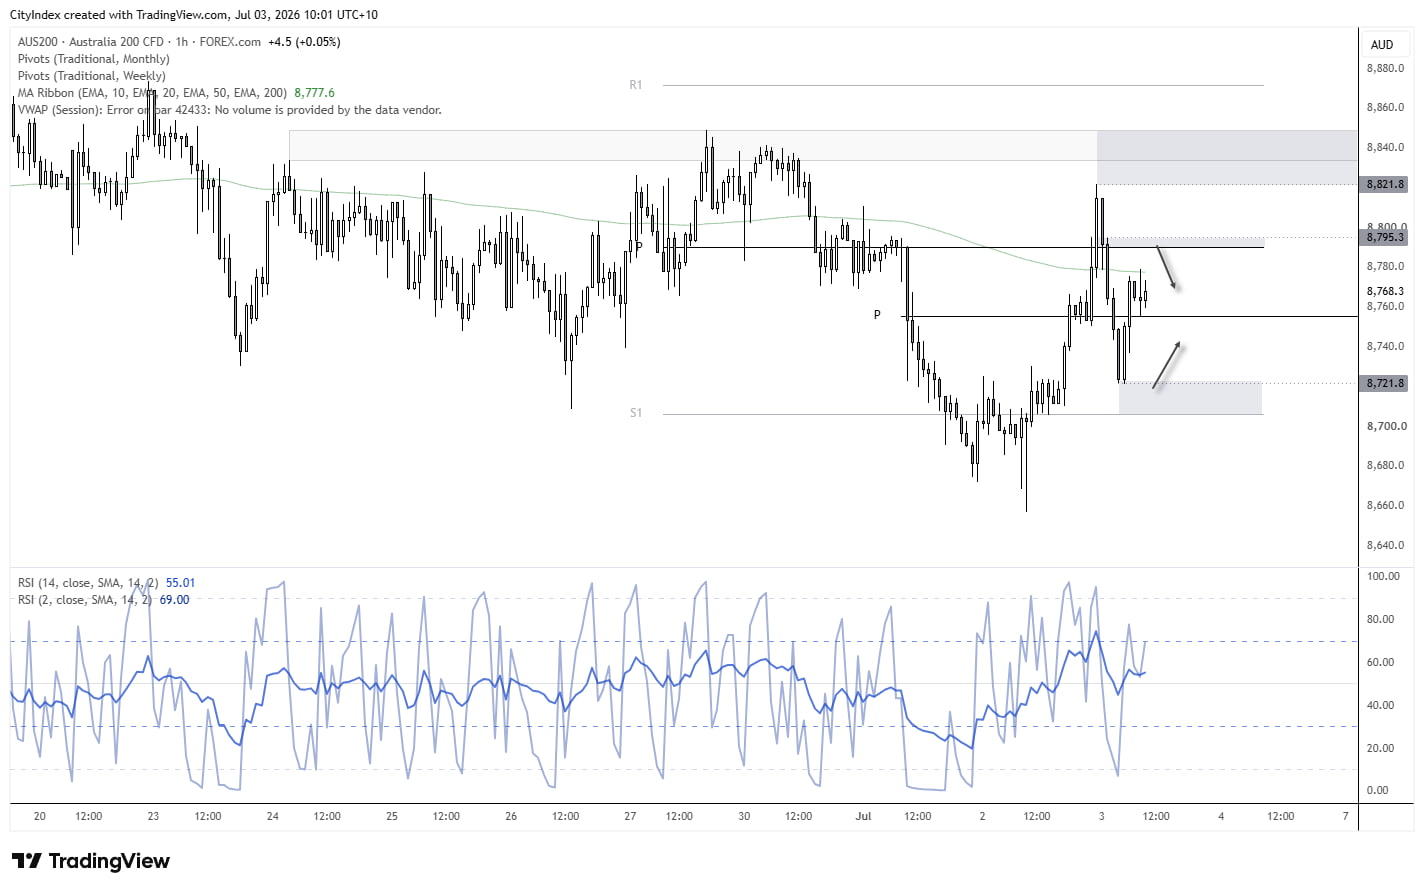
The 1-hour chart shows the ASX caught between a rock and a hard place, trapped between the weekly and monthly pivot points, with the 200-hour EMA also capping gains for now. Given Friday tends to be the least volatile day of the week, conditions could remain choppy with fickle price action. Bears may therefore look to fade rallies into resistance around the monthly pivot point or the 8800 handle, while bulls may seek buying opportunities around support levels such as Thursday's 8721 low or the 8700 handle near the weekly S1 pivot.
Source: Forex.com, TradingView
View the full economic calendar
-- Written by Matt Simpson
Follow Matt on Twitter @cLeverEdge