
Weekly Technical Trade Levels on USD Majors, Commodities & Stocks
- Technical trade setups we are tracking into the start of the week on the USD Majors, commodities, bitcoin, and equity indices amid the ongoing war in Iran
- Event risk on tap: Iran war headlines, Eurozone, US, UK PMI and CPI data from Australia & UK
- Next Weekly Strategy Webinar: Monday, March 30 at 8:30am ET
- Review the latest Video Updates or Stream Live on my YouTube playlist
In this webinar we take an in-depth look at the technical trade levels for the US Dollar (DXY), Euro (EUR/USD), British Pound (GBP/USD), Australian Dollar (AUD/USD), Canadian Dollar (USD/CAD), Japanese Yen (USD/JPY), Swiss Franc (USD/CHF), Gold (XAU/USD), Crude Oil (WTI), and Bitcoin (BTC/USD), and S&P 500 (SPX500), Nasdaq (NDX), and Dow Jones (DJI). These are the levels that matter on the technical charts into the weekly open.
US Dollar Price Chart – USD 240min (DXY)
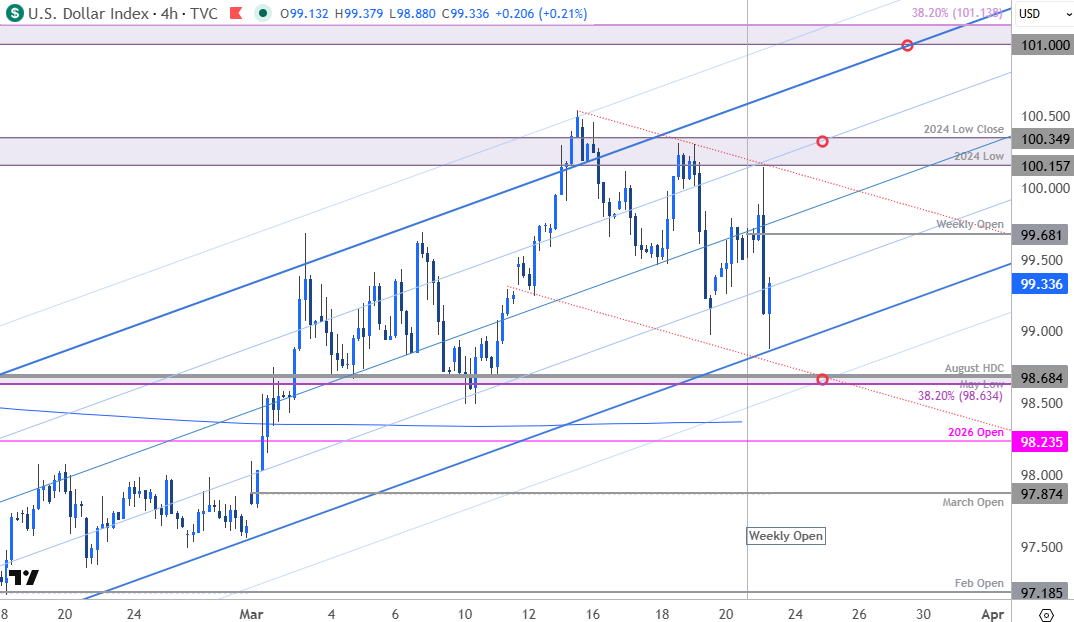
Chart Prepared by Michael Boutros, Sr. Technical Strategist; DXY on TradingView
Notes: The US Dollar Index has been trading within the confines of an ascending pitchfork extending off the mid-February low with the March rally faltering at key resistance last week. DXY dropped into uptrend support today after President Trump announced that discussions were underway for a possible end to the Iran war. The focus is on this slope with key support seen just lower at 98.63/68- a region defined by the 38.2% retracement of the January advance, the August high-day close (HDC) and the May swing low. A break / close below this threshold would be needed to suggest a more significant high is in place and a larger trend reversal is underway. Subsequent support rests with the objective yearly open at 98.24 and the March open at 97.87.
Weekly open resistance is eyed at 99.68 with key resistance at the 2024 low / low close at 100.16/35. A breach / weekly close above this major pivot zone is needed to mark uptrend resumption towards the 38.2% retracement of the 2025 decline at 101.00/13. Look for a larger reaction there IF reached.
Bottom line: The US Dollar is trading just above uptrend support, and the focus is on a reaction off this slope in the days ahead. From a trading standpoint, losses would need to be limited to 98.63 IF price is heading higher on this stretch with a close above 100.35 needed to fuel the next leg of the advance. Keep in mind that the markets remain hyper-sensitive to headlines out of the Middle East and IF the 200-DMA is compromised (currently near ~98.36), the bottom could give way with some aggression here. The economic docket is rather light this week so keep a close eye on the war headlines and stay nimble here.

Australian Dollar Price Chart – AUD/USD 240min
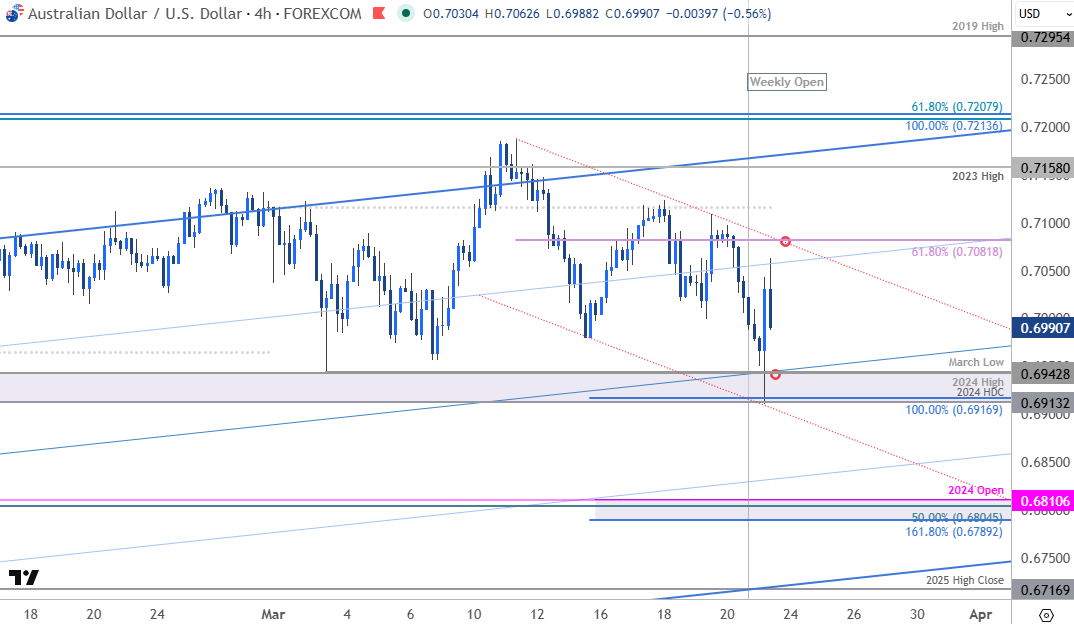
Chart Prepared by Michael Boutros, Sr. Technical Strategist; AUD/USD on TradingView
Notes: Aussie dropped more than 3.8% off the monthly high with price rebounding off key support today at 6913/42- a region defined by the 2024 high-day close (HDC), the 100% extension of the monthly decline, the 2024 swing high, and the March low. Note that the median-line of the broader 2025 uptrend and the lower parallel converge on this zone in the days ahead and the focus is on the reaction off this mark.
Key near-term resistance is eyed at the 61.8% retracement of the most recent decline at 7082 which converges on channel resistance over the next few days. A topside breach / close above this slope would threaten resumption of the uptrend towards subsequent resistance objective at the monthly open at 7116 and the 2023 swing high at 7158. The next major technical consideration is eyed at the 100% extension of the 2025 advance and the 61.8% retracement of the 2021 decline at 7208/14- look for a larger reaction there for guidance IF reached.
A break below this key support pivot would threaten a larger correction within the broader uptrend with more significant support see at 6790-6811- a region defined by the 1.618% extension, the 50% retracement / 2024 yearly open. This represents an area of interest for possible downside exhaustion / price inflection IF reached.
Bottom Line: Aussie is trading just above confluent support at the March opening-range lows and we’re looking for possible inflection off this mark. From a trading standpoint, rallies would need to be limited to 7082 IF price is indeed heading lower on this stretch with a close below 6917 needed to fuel the next leg of the decline.
Economic Calendar – Key Data Releases
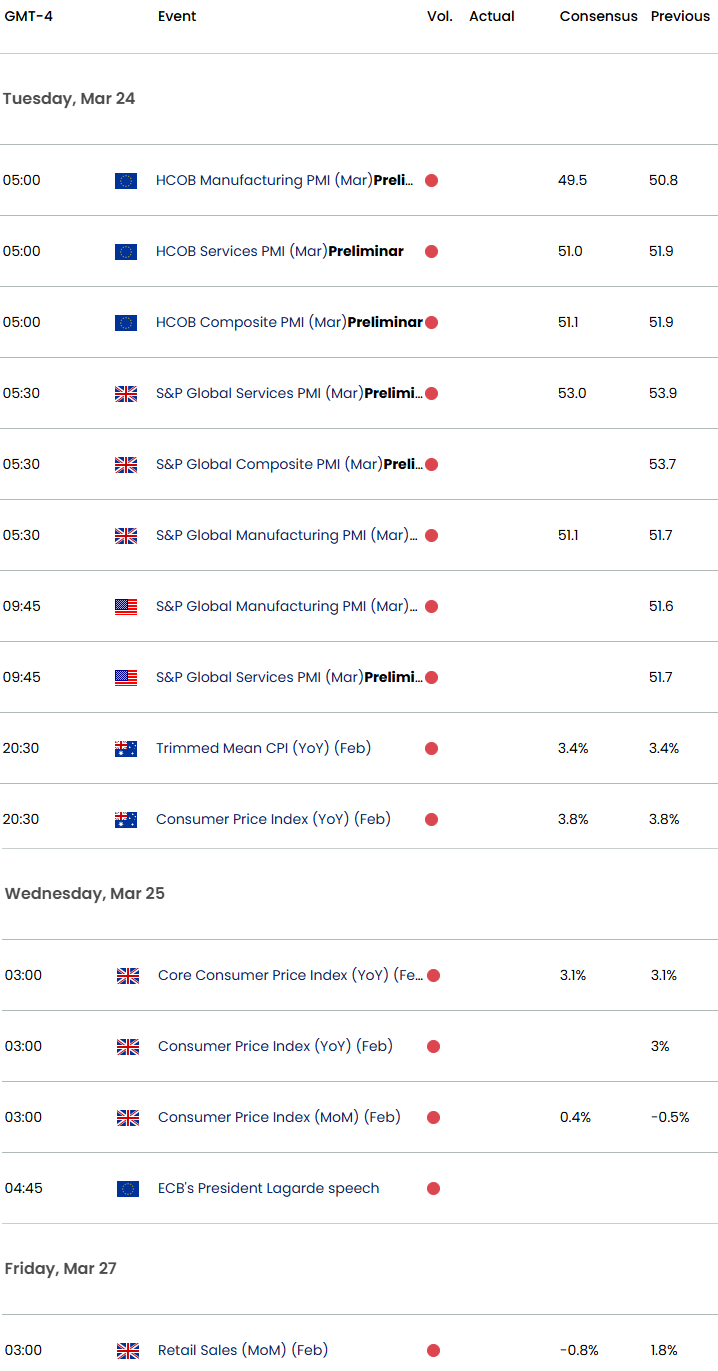
Economic Calendar - latest economic developments and upcoming event risk.
--- Written by Michael Boutros, Senior Technical Strategist
Follow Michael on X @MBForex