


Key Events
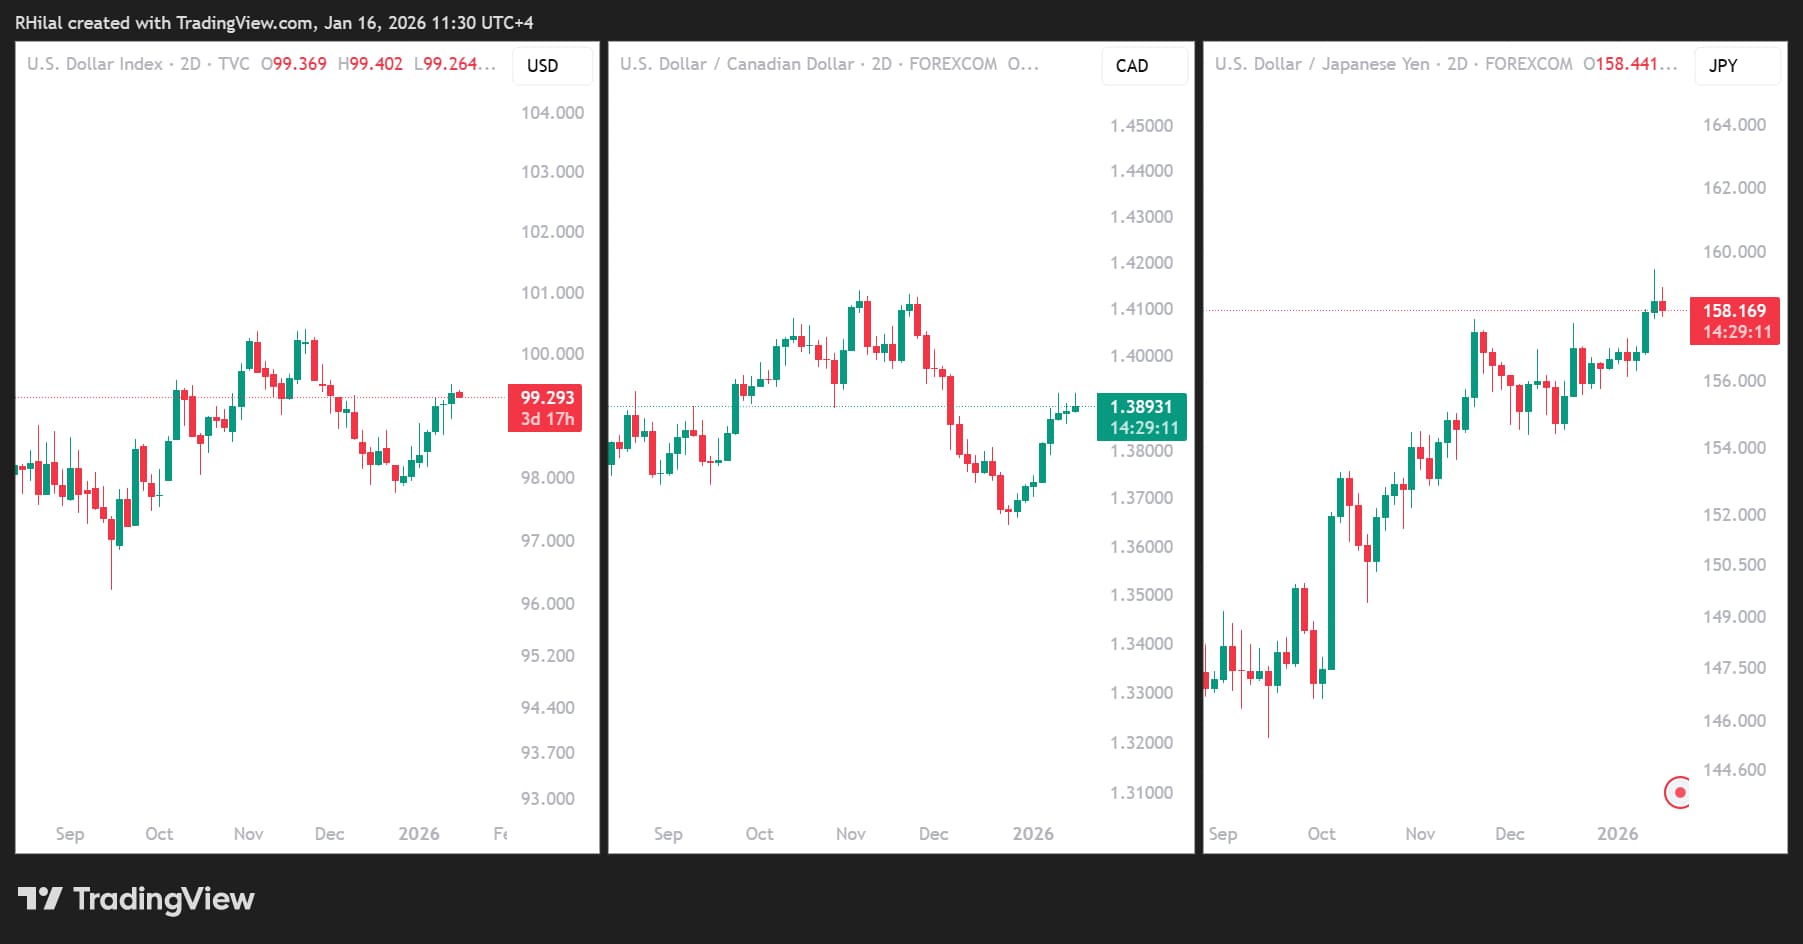
- Fed rate-hold expectations have risen to a probability of 95%, aligning the DXY, USDJPY, and USDCAD near key resistance zones at 99.50, 160, and 1.39.
- Ongoing geopolitical worries continue to support global haven demand, including precious metals and the US dollar.
- Rate expectations are likely to evolve throughout the year as growth and inflation dynamics shift, increasing the importance of key levels and primary trends on higher time frames to support effective risk management.
DXY, USDCAD, USDJPY – 2 Day Time Frame – Log Scale
Source: Trading view
Between September and December, the DXY and USDCAD advanced toward key resistance levels, completed a double-top target, and reversed higher in line with early-2026 headlines. The third chart, USDJPY, continues to trace a steeper bullish curve toward the key 160 level, reflecting the wide interest-rate differential and the ongoing preference for the US dollar over the yen.
Despite these waves signaling a bullish bias, critical resistance levels remain in focus to confirm the longer-term trend outlook for the DXY. This aligns with a view I have consistently maintained, highlighting upside risk supported by a 17-year uptrend extending from the 2008 lows, despite recurring dovish signals and intermittent soft economic data.
From a long-term perspective, historical price structure continues to dominate. As the saying goes, the trend is your friend. A structure that has held for more than 17 years tends to outweigh short-term headlines and temporary fluctuations. Only a clear structural break would raise the risk of a broader trend shift.
Returning to the charts, with a hawkish Fed tone, neutral rate expectations, and geopolitical frictions in play, the dollar is attempting to shed its 2025 bearish narrative. Short-term key levels remain decisive in confirming this shift, particularly given their impact on positioning across the euro, pound, Canadian dollar, and other major FX pairs.
US Dollar Index – 3-Day x Monthly Time Frame Charts
Source: Trading view
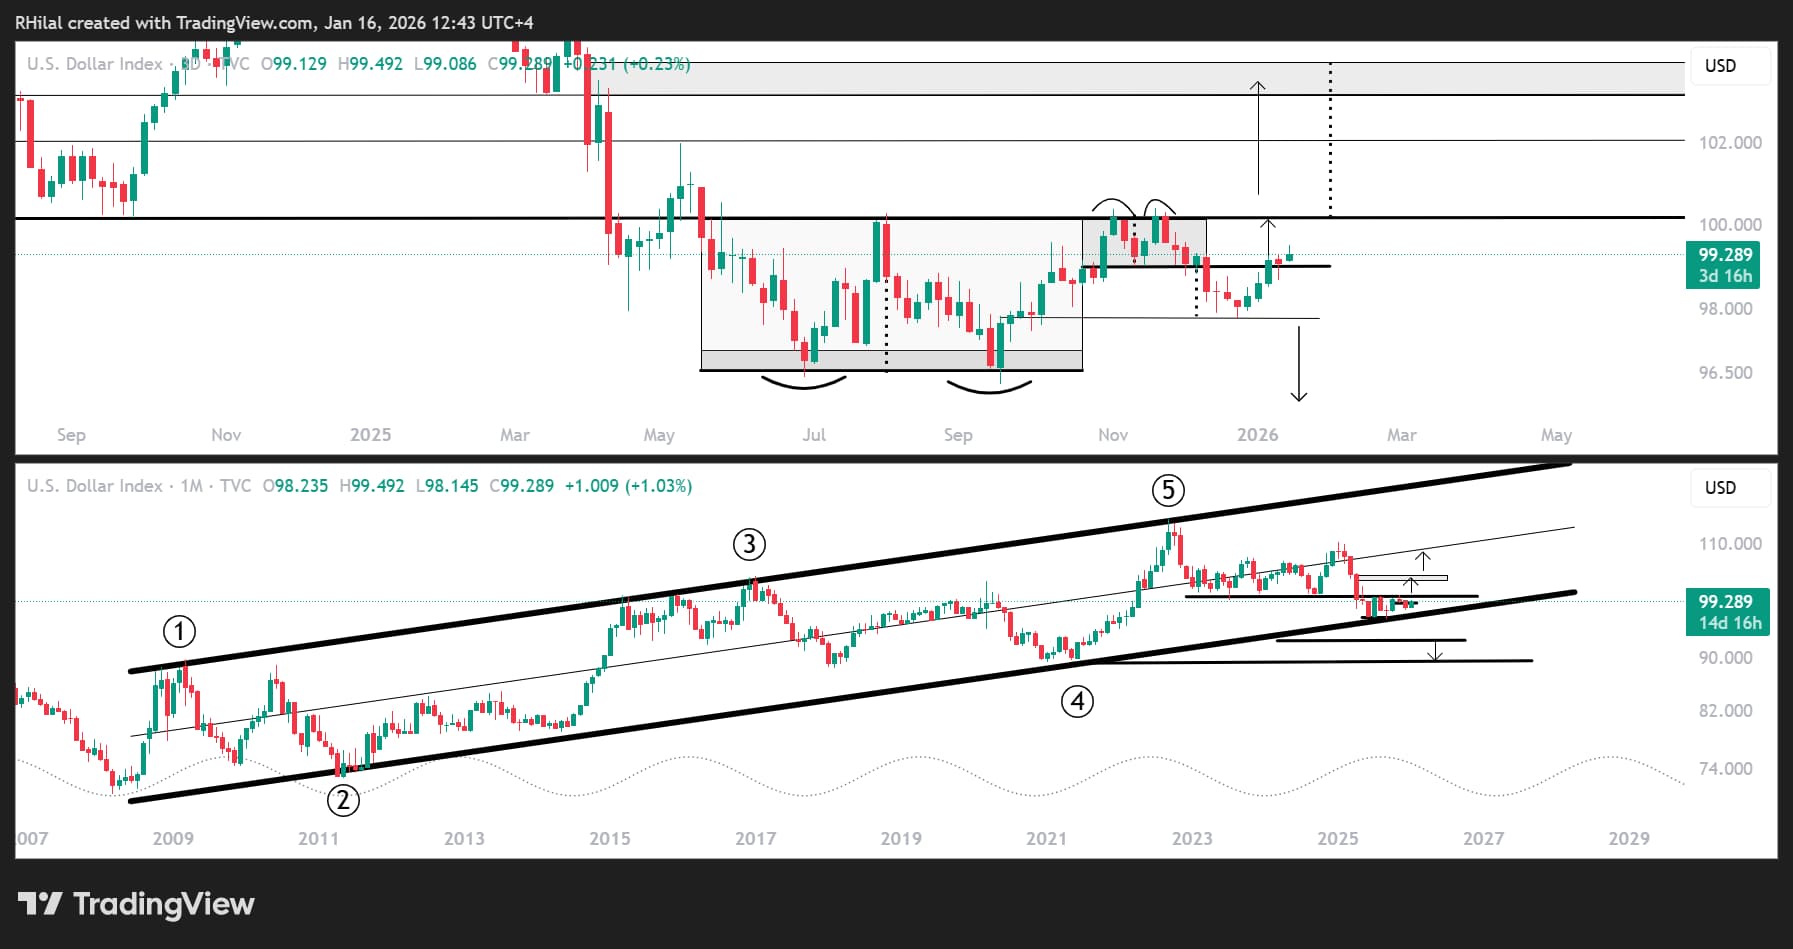
The upper chart highlights the 3-day timeframe, showing a double rebound from the 96 support alongside a renewed double-top formation near the 100.40 resistance.
On the monthly chart, the 96 support remains positioned above a 17-year trendline originating from the 2008 lows, while the 100.40 resistance aligns with a former major support zone from July 2023. Together, these levels define two critical long-term reference points for the DXY, with direct implications for major currency pairs.
A sustained break above 100.40 would likely trigger renewed downside pressure across major FX pairs, with bullish DXY targets at 103, 103.20, and 104, aligning with the measured objective of a potential double-bottom formation at the 2025 lows.
On the downside, bearish pressure may rebuild should the DXY fall below 97.70, exposing the 96 support and potentially opening the door to a deeper retracement toward the 2021 lows near 89.
USDCAD 3-Day Time Frame – Log Scale
Source: Trading view
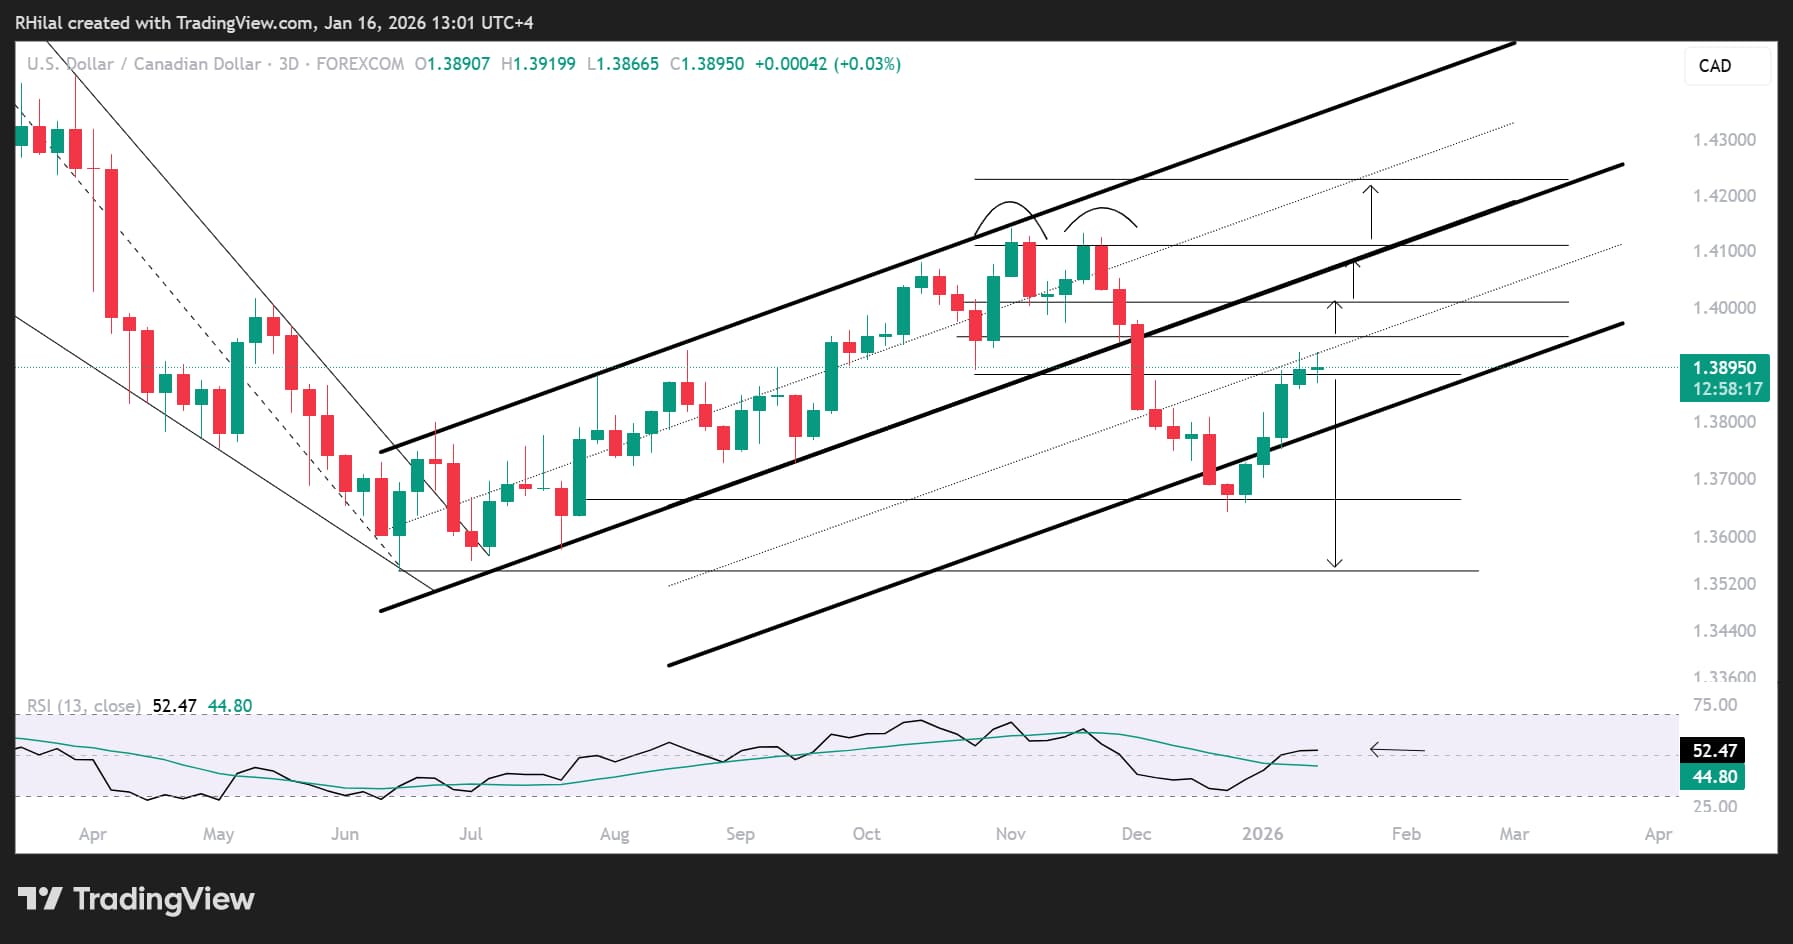
From a 3-day perspective, USDCAD is holding a bullish rebound from the 1.3640 low, supported by a recovery in the 3-day RSI back above the 50 level from oversold conditions last seen in June 2025. Price action remains capped below the 1.3940 resistance, with upside levels at 1.40, 1.4110, and 1.4230, derived using the Fibonacci extension tool applied to the June 2025 low, November 2025 high, and December 2025 low.
On the downside, a move below 1.38 would increase drawdown risk, in line with a bearish DXY scenario, exposing 1.3660 and 1.3540.
USDJPY – 3 Day Outlook – Log Scale
Source: Trading view
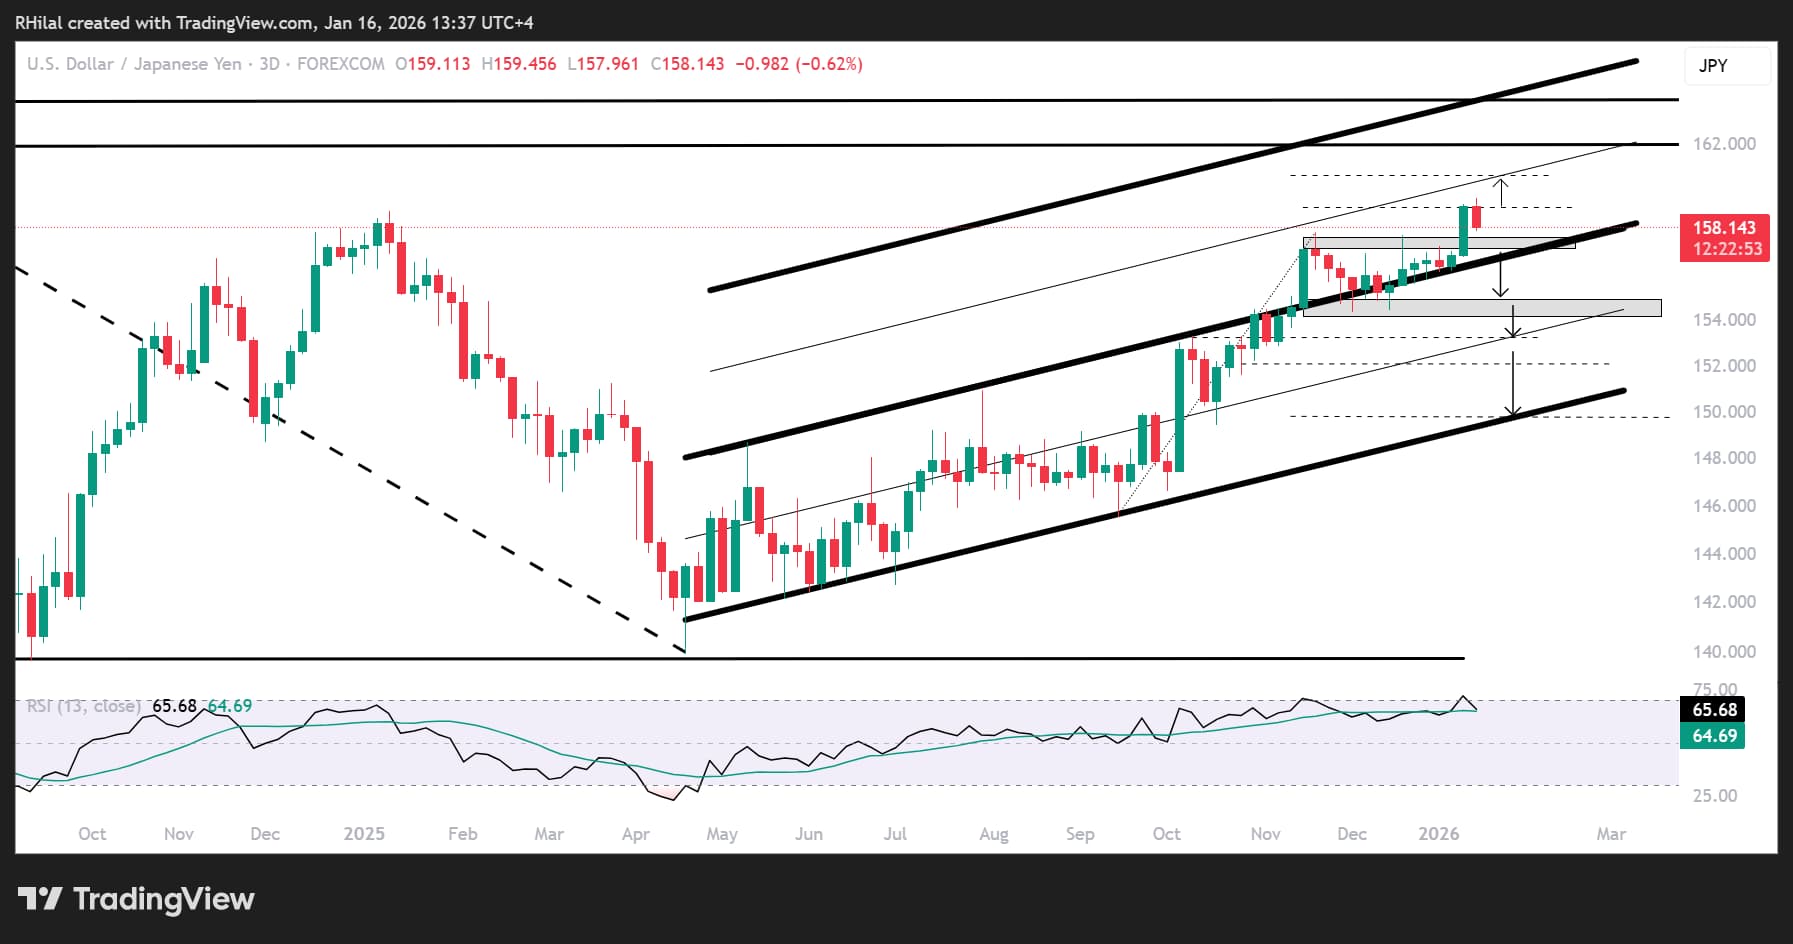
The 3-day RSI (13) highlights a price structure in USDJPY that has closely respected overbought and oversold conditions since September 2024. The recent cycle—spanning the April 2025 lows to the January 2026 highs—signals a stretched phase, increasing consolidation risk relative to the more structured setups seen in the DXY and USDCAD.
As long as USDJPY holds below the 160 resistance, yen weakness and potential intervention risks remain in focus. A clean hold above 160.50, the mid-zone of the respected duplicated channel between April and November 2025, would likely extend gains toward 162 and 164, near the channel’s upper boundary, where momentum-driven pullback risks are expected to re-emerge.
Written by Razan Hilal, CMT
Follow on X: @Rh_waves






