


It was in last year’s US equities forecast that I made the connection between the frothy conditions of the AI boom to the Dot Com bubble thirty years earlier. By the end of 2025 that had become a much more common narrative and as we go into 2026, valuations are without a doubt concerning. But, as I said a year ago, a growing bubble doesn’t necessarily mean a market condition ready to ‘pop’ and as we push into the New Year, I remain of the mind that there’s more to go before we see reversion to the mean. And, for now, pullbacks are buying opportunities as stocks have continued to stretch towards fresh all-time-highs.

In my Q4 Forecast, I provided a year-end profit target of 6958 for SPX and as I write this with two weeks remaining in the year, that remains an attainable target. On October 29th, the date of the Fed’s second rate cut of the cycle, the index came within 0.5% of that level before pulling back. That pullback was ultimately driven by fear that the Fed might avoid a December rate cut, which ended up going through anyways, but that driver highlights what’s important for stocks as we push into 2026 trade.
SPX Weekly Price Chart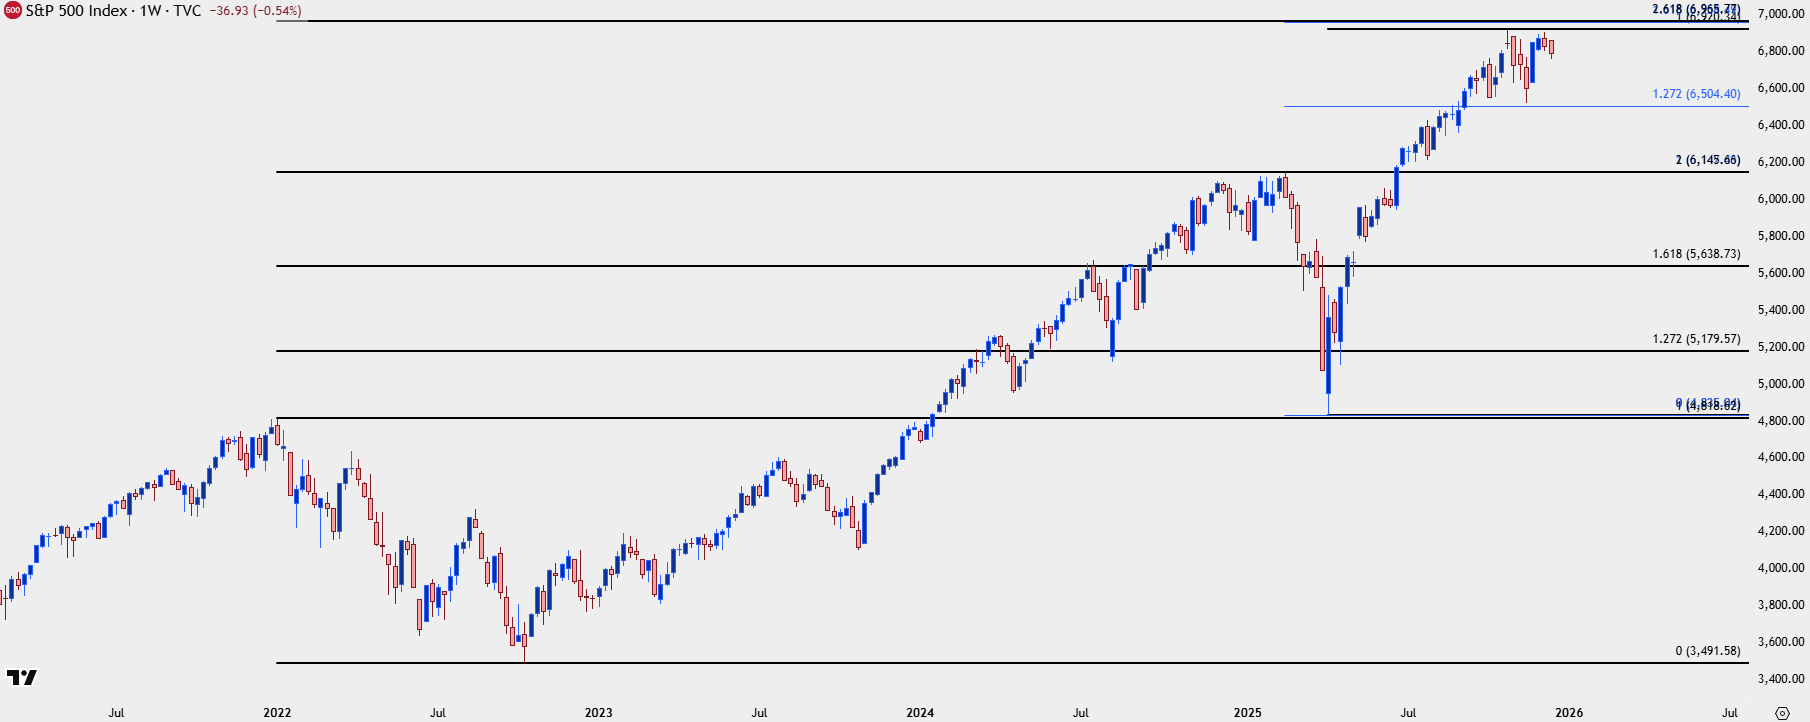
Chart prepared by James Stanley; data derived from Tradingview
2026 Equities Forecast: Technicals
SPX Target: 7500
For 2026 I’m looking for a target of 7500 on SPX. This is a confluent spot with both the 27.2% extension of the April-October rally and a 100% measured move of the early-2025 sell-off. That structure was validated a couple of different times, in my opinion, as the 27.2% extension was resistance that was later defended as support, and the 61.8% extension was my 2025 year-end target which was less than 0.5% away from the high; and with two weeks left in the year remains a viable target by year-end.
SPX Daily Price Chart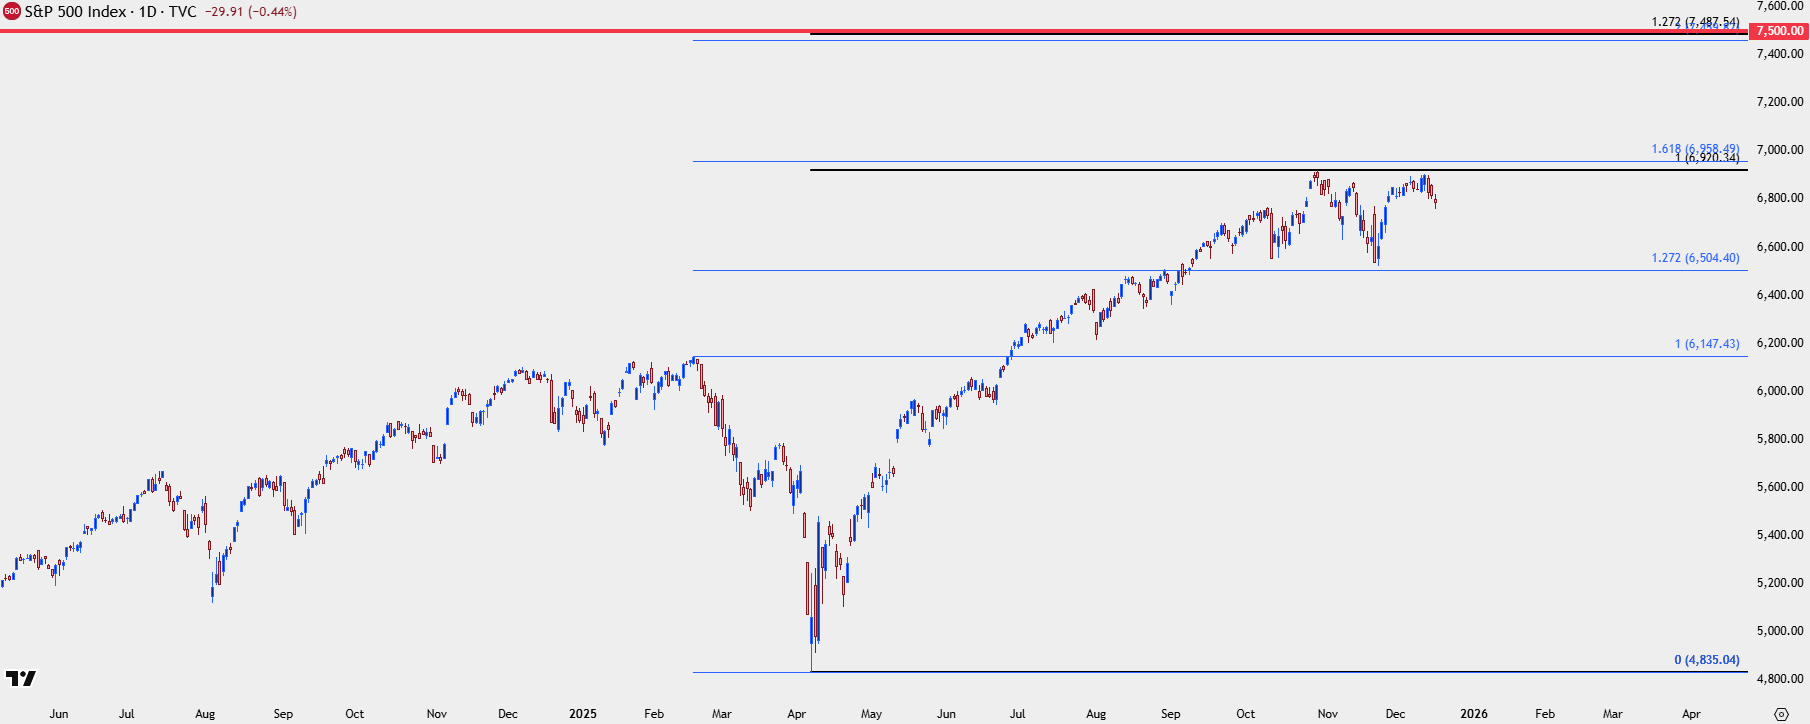
Chart prepared by James Stanley; data derived from Tradingview
Nasdaq 100
In the 2025 Forecast and for my top trade idea for the year, I looked at the long side of equities but only after a pullback. In the Nasdaq, it was my third level of support, around the 17k level that was tested at the April lows and ultimately led into a massive rally of 58.27% into the 2025 high.
For next year my stance is the same: The long side remains attractive but from a risk management perspective price is simply too high to chase up to higher-highs. So, for pullbacks, there remains interest for continuation scenarios and the spot that I think would ideally come into play is the 24k level that was resistance-turned-support. Below that, the 22,133-22,500 area is of interest, and the 20k-20224 zone can also be argued as an ‘s3’ spot of support. If bulls can’t hold prices above that then we’re likely already seeing some significant change on the horizon.
Nasdaq 100 Daily Chart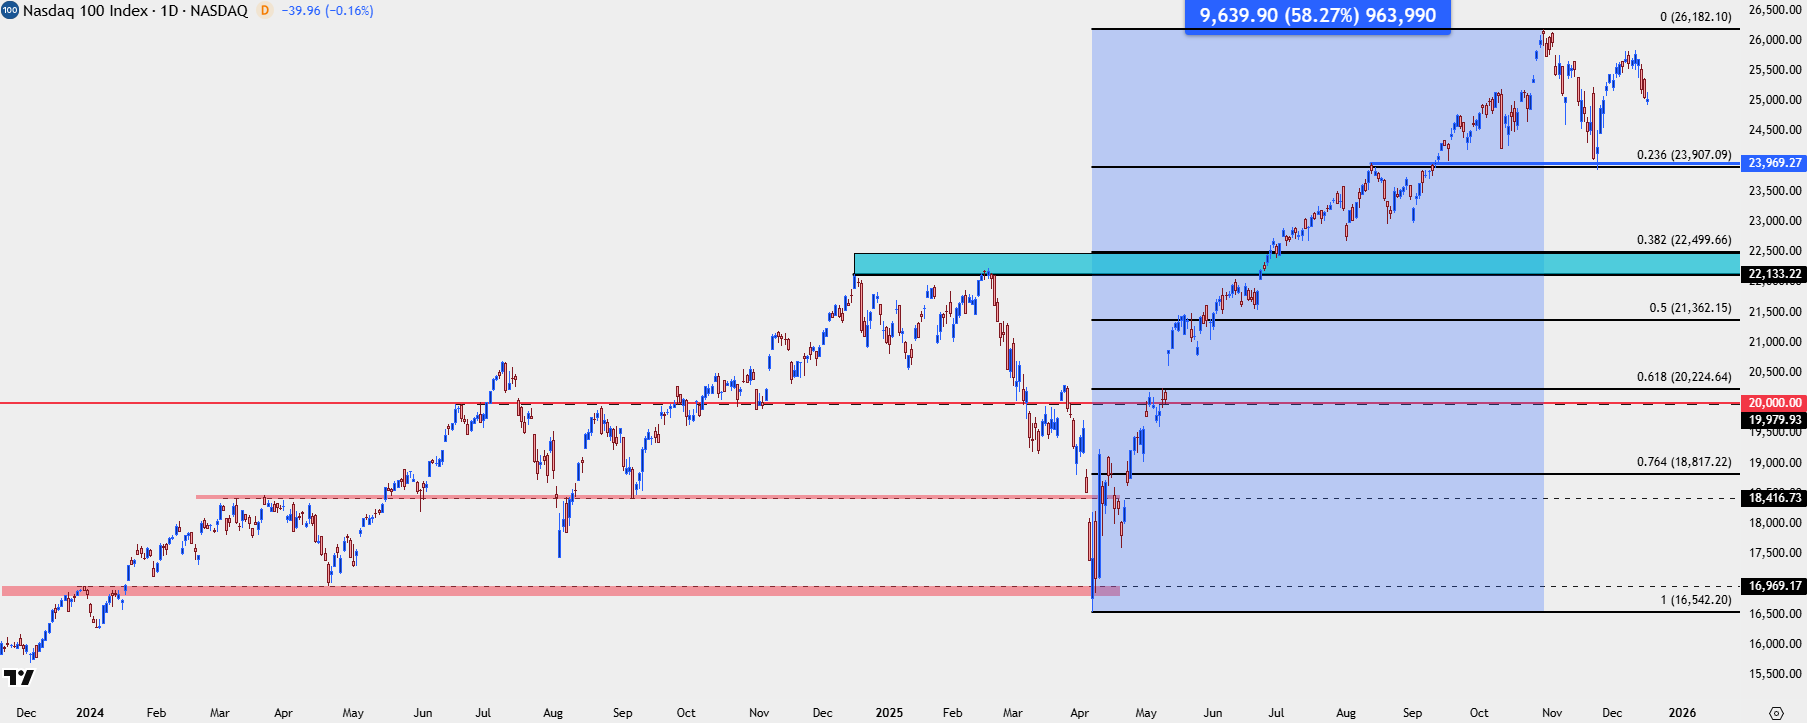
Chart prepared by James Stanley; data derived from Tradingview
--- written by James Stanley, Senior Market Analyst, Global Macro





