Indices Forecast
Don’t look now but the equity rally is broadening as small cap stocks, which couldn’t quite keep pace with AI and large caps in general have very much led the way so far in early-2026 trade. Russell 2000 futures are up more than 7.8% so far through the first couple weeks of the year, and this compares to just over 1% in the Nasdaq and 1.4% in S&P 500 futures. That’s not necessarily bad news, as it could be illustrative of a hunt for value as markets price-in fiscal stimulus set to come online this year from President Trump’s Big Beautiful Bill. But the fact that high-flying AI stocks that have been such a large focal point for most of the past three years are losing favor is something that could, potentially, become notable before too long.
At this stage, however, that is highly speculative as all that we’ve seen from buyers is continued support and a response to pullbacks. Another showed this week in the S&P 500, and this keeps bulls in-control of near-term price action. But, it does highlight a possible source of fragility that could soon come into play down-the-road if the shoe drops on inflation and pushes the Fed away from 2026 rate cuts.
As I looked at in the 2026 forecast for equities, there’s no sign yet that buyers are ready to relinquish the reigns and with a potent combination of President Trump pushing fiscal stimulus (and pumping markets via social media) to go along with a Federal Reserve that seems almost afraid to move out of tune from what the President wants, there remains an open backdrop for continued strength in equities.
The challenge at this point is strategy, as chasing fresh highs and just hoping it works out could be a lackluster way of approaching the matter. Pullbacks, however, with shows of support, similar to what showed last week or, bigger picture, back in April of last year, could be a much more attractive way to go about it. Unfortunately, for that, patience is required, and that’s seemingly the challenge point for many traders.
Russell 2000
Small cap stocks were largely left behind when equity rallies kicked into gear in 2023, and to a lesser degree, in 2024. It was the 2460 level that the Russell 2000 just could not take out and that held two different resistance tests in 2021 and then three years later in 2024.
For last year, there was about three months of struggle at that price until buyers ultimately prevailed, finally beginning to take control in late-2025 trade which has led into the sizable rally so far to start this year.
At this point, price has already pushed up to the 127.2% Fibonacci extension of last year’s pullback and this is a tough area to chase, highlighting a couple of key spots of support to look for pullbacks.
Russell 2000 Weekly Chart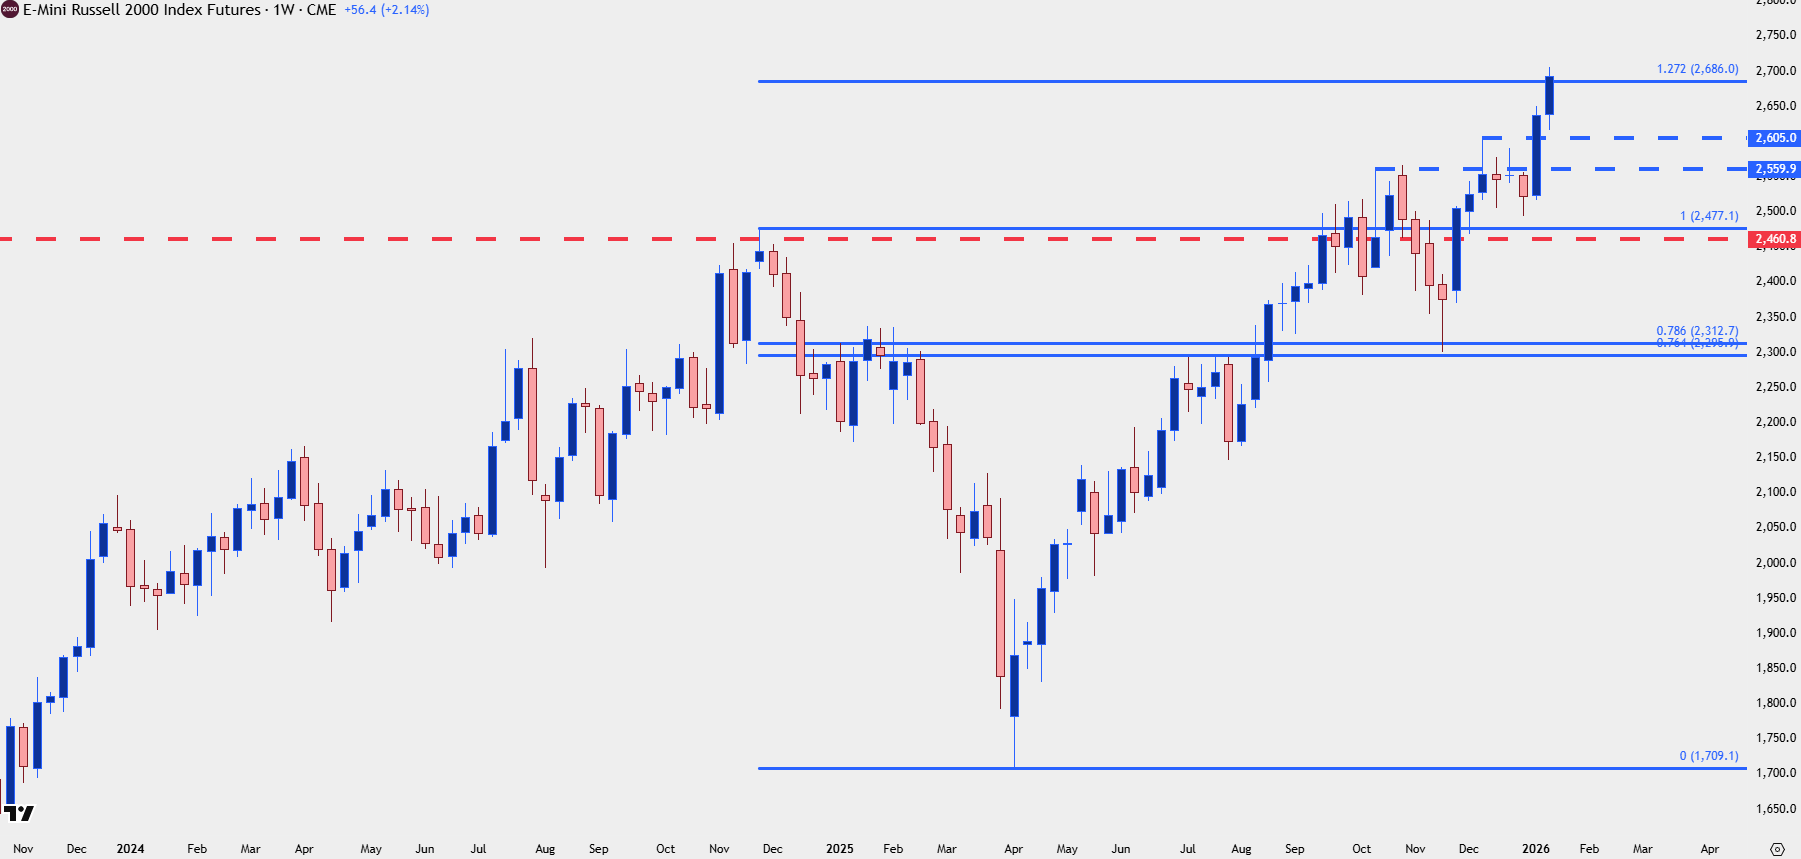
Chart prepared by James Stanley; data derived from Tradingview
Russell 2000 Structure
From the daily chart there’s two different spots of prior resistance that stand out as higher-low support potential, with 2605 nearby and 2556 just below that, with each functioning as an ‘s1’ and ‘s2,’ respectively. For ‘s3,’ it’s the same resistance that was such a big deal for the past five years, spanning from 2460 up to around the 2500 level which was the last higher-low before the current breakout.
A pullback to that ‘s3’ zone can keep the door open for bulls, but if we see failure there, that’s when the broader breakout is going to look as though it had also failed. But, as the old saying goes, it’s support until it’s not.
Russell 2000 Daily Chart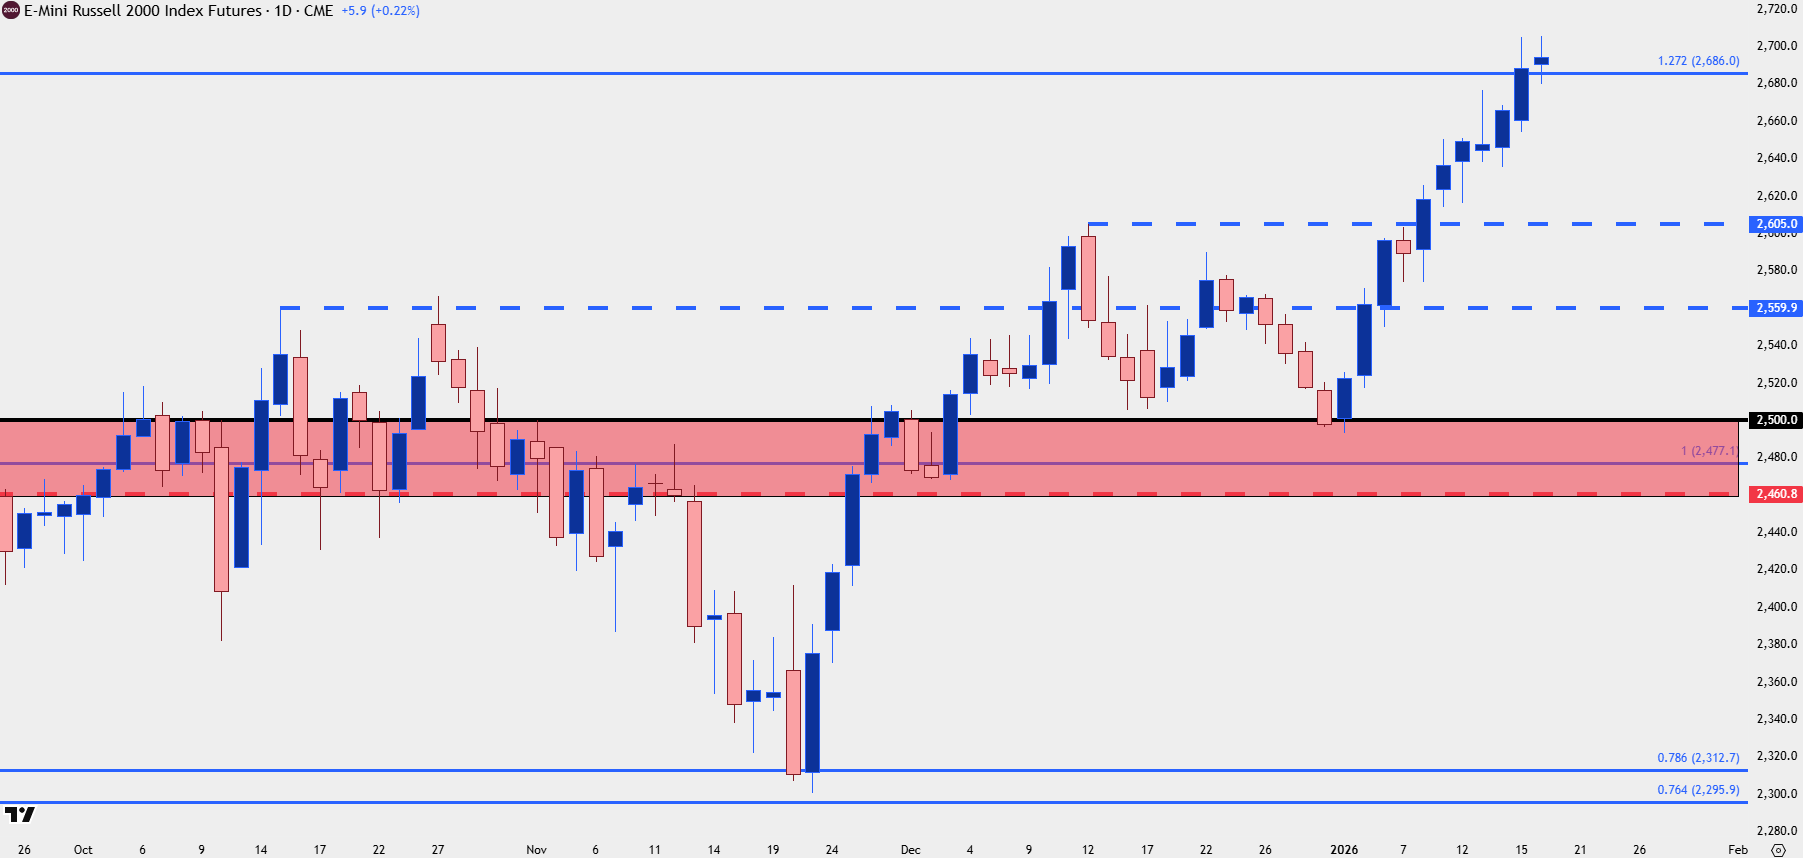
Chart prepared by James Stanley; data derived from Tradingview
SPX
The shorter-term problem that shows in the Russell above has a much larger role in the S&P 500 below, as prices have only continued to grind into a tighter and tighter range with a long-term ascending wedge building. These are bearish reversal formations and it was the underside of support that was in-play last week to help hold the lows.
These formations are indicative of prolonged and stretched trends, which can be prone to snapping back given that buyers are showing less and less willingness of pushing while at fresh highs or near resistance.
S&P 500 Daily Chart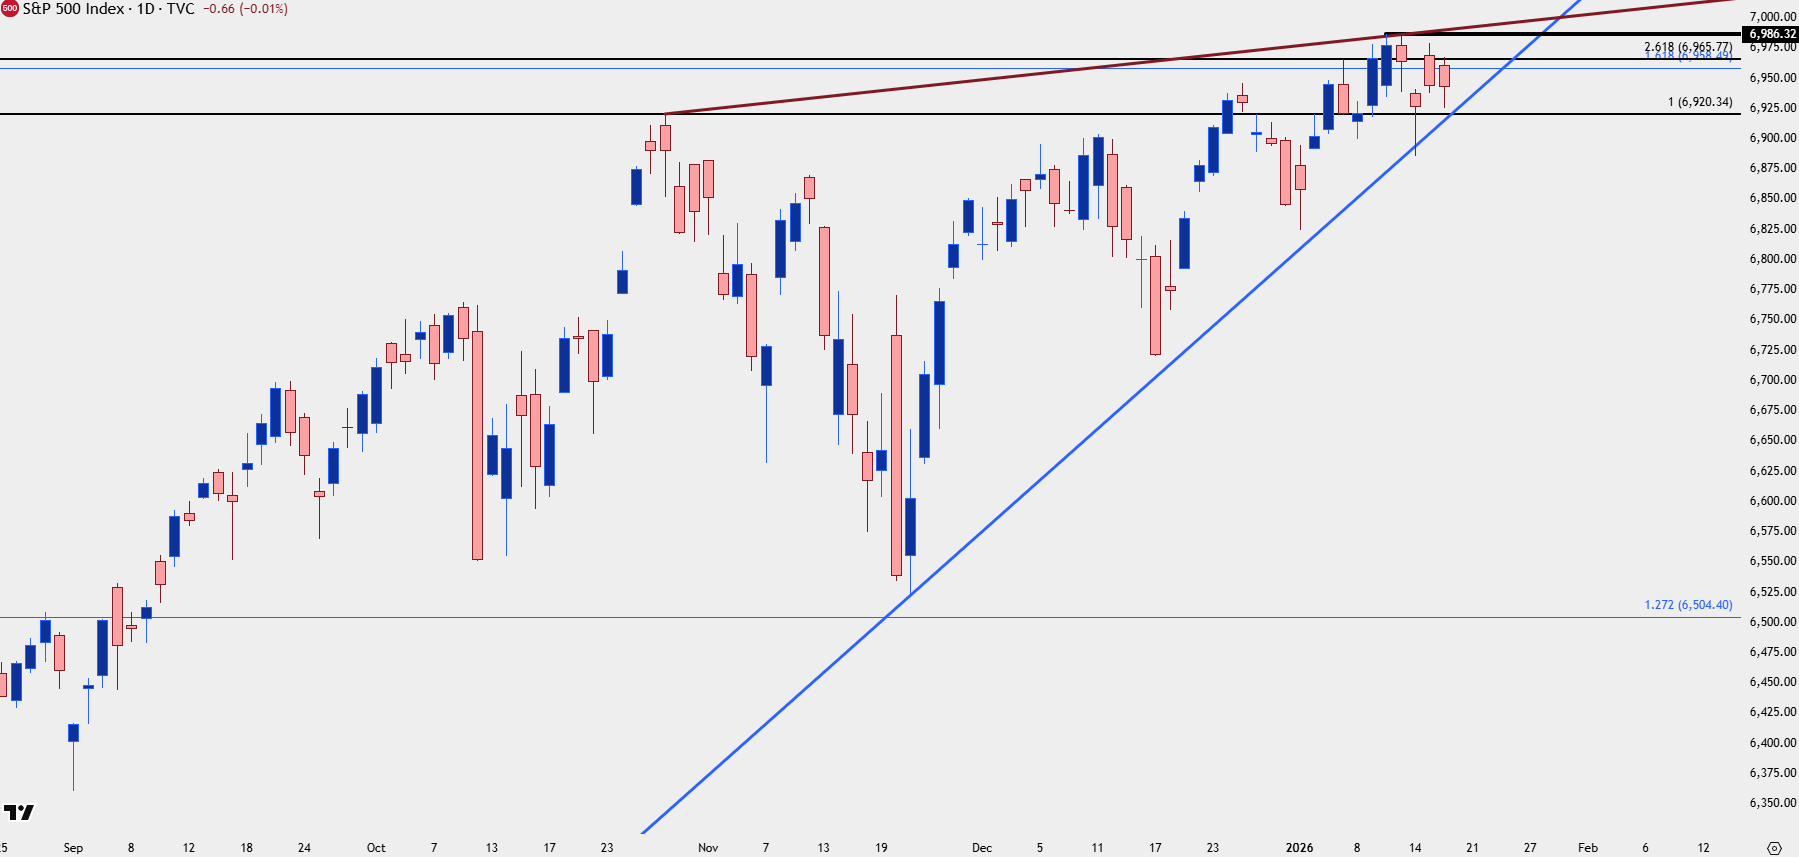
Chart prepared by James Stanley; data derived from Tradingview
SPX Shorter-Term
First off, not all formations come to fruition. For an ascending wedge to come into play there has to be a break of the support trendline, thereby opening the door for buyers to take a step back. That’s what did not happen last week, as the early-week pullback found support at the trendline projection produced by the April and November swing-low, and that held, with prices pushing up towards the prior ATH that was set on Monday.
The rest of the week was a grinding affair but there was another hold of support following a fill of the Thursday gap, and this further illustrates that buyers remain in-control of SPX.
At this point, I’m a bit less optimistic here than the above in the Russell 2000, but I do think this backdrop in SPX is more attractive than what I’ll look at next in the Nasdaq given that SPX has set a fresh ATH just last week while the Nasdaq hasn’t for the past almost three months. For next week, the important support structure is the 6920 area which is confluent with the bullish trendline after the open on Tuesday.
SPX Four-Hour Price Chart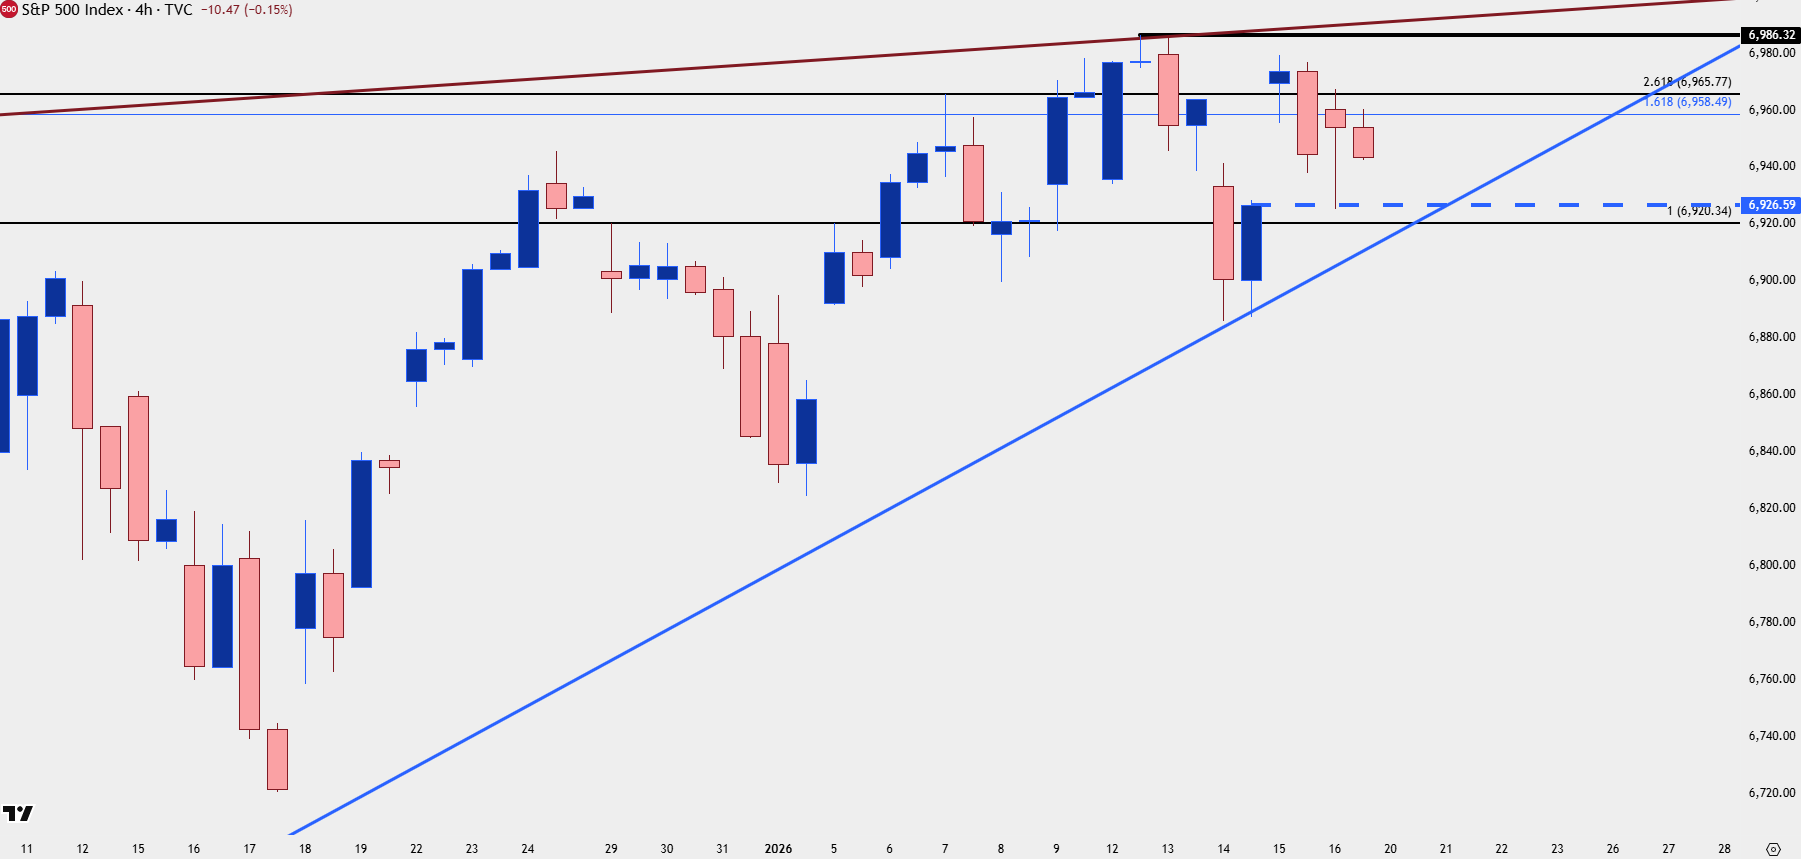
Chart prepared by James Stanley; data derived from Tradingview
Nasdaq 100
The good news for the Nasdaq is that, despite the lack of any fresh all-time-highs since October 29th, the date of the Fed’s second rate cut last year, the bearish formation looked at above in SPX is countered by a bullish formation in the Nasdaq 100.
In the Nasdaq 100, there’s been a hold of lower-highs at 25,827 and that’s a price that’s been in-play a few different times over the past couple months. It’s also displaying a diminishing marginal impact, as higher-lows have developed, helping to build an ascending triangle formation.
Ascending triangles are bullish breakout formations and this points to the possibility of a re-test of the prior ATH at 26,182 for the index.
Nasdaq 100 Daily Chart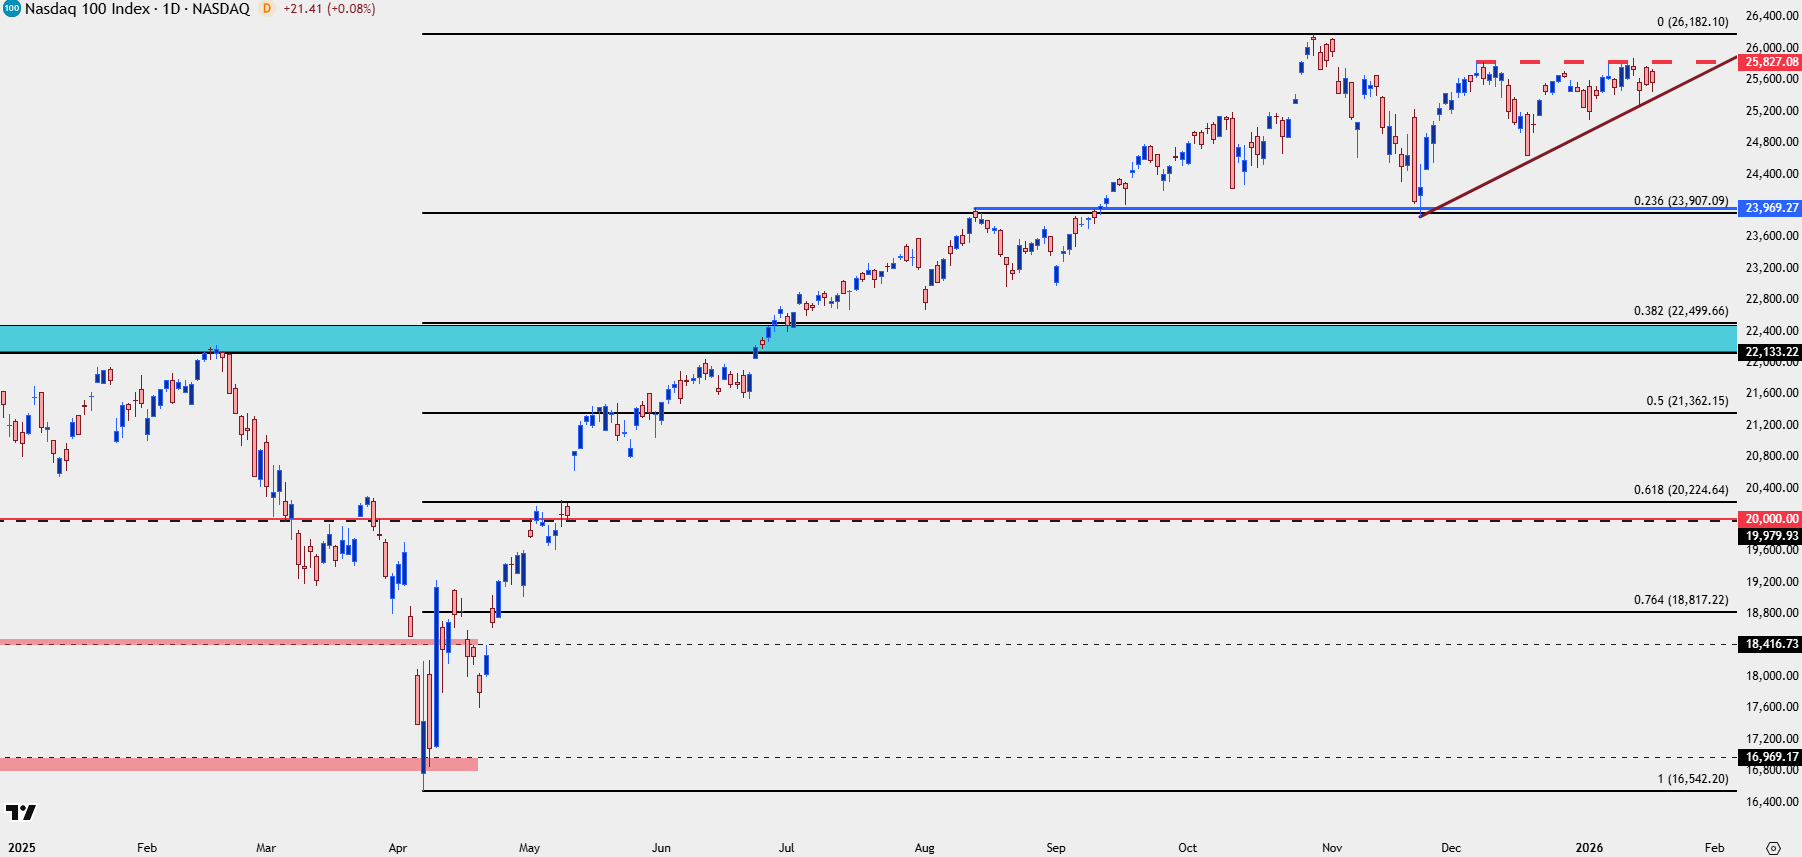
Chart prepared by James Stanley; data derived from Tradingview
--- written by James Stanley, Senior Market Analyst, Global Macro