


Defining support levels are coming into focus across key charts, including EUR/USD and the Nasdaq, following the Federal Reserve’s rate hike and a 6% drawdown in UKOIL.
Although markets are pricing in a probability of more than 50% for another 25-basis-point rate hike at the October meeting, according to the CME FedWatch Tool, the potential reversal in crude oil and U.S. Treasury yields may help shield markets from further drawdowns.
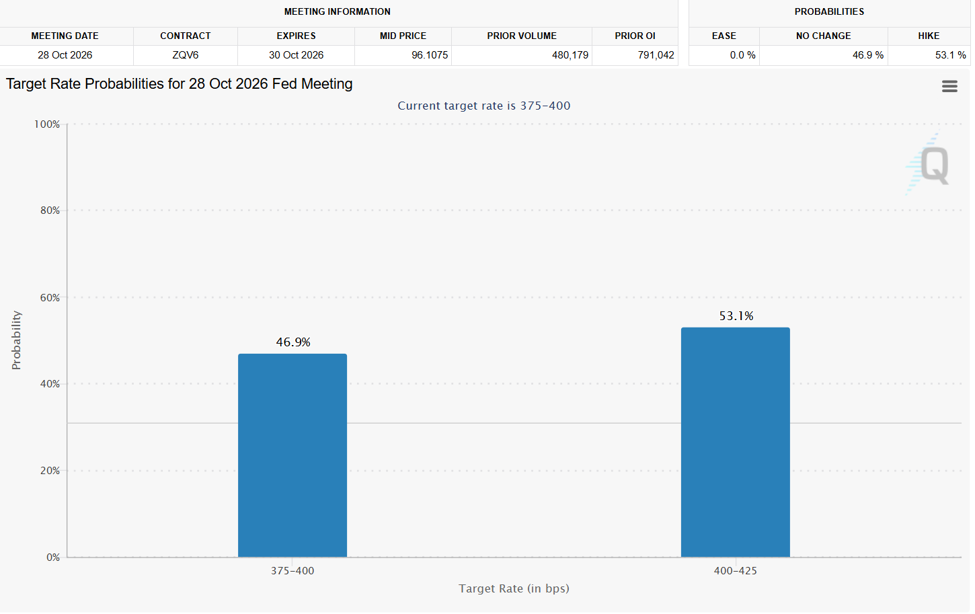
Source: CME FedWatch Tool
U.S. 10-Year Treasury Yields and UKOIL — Daily Time Frame — Log Scale
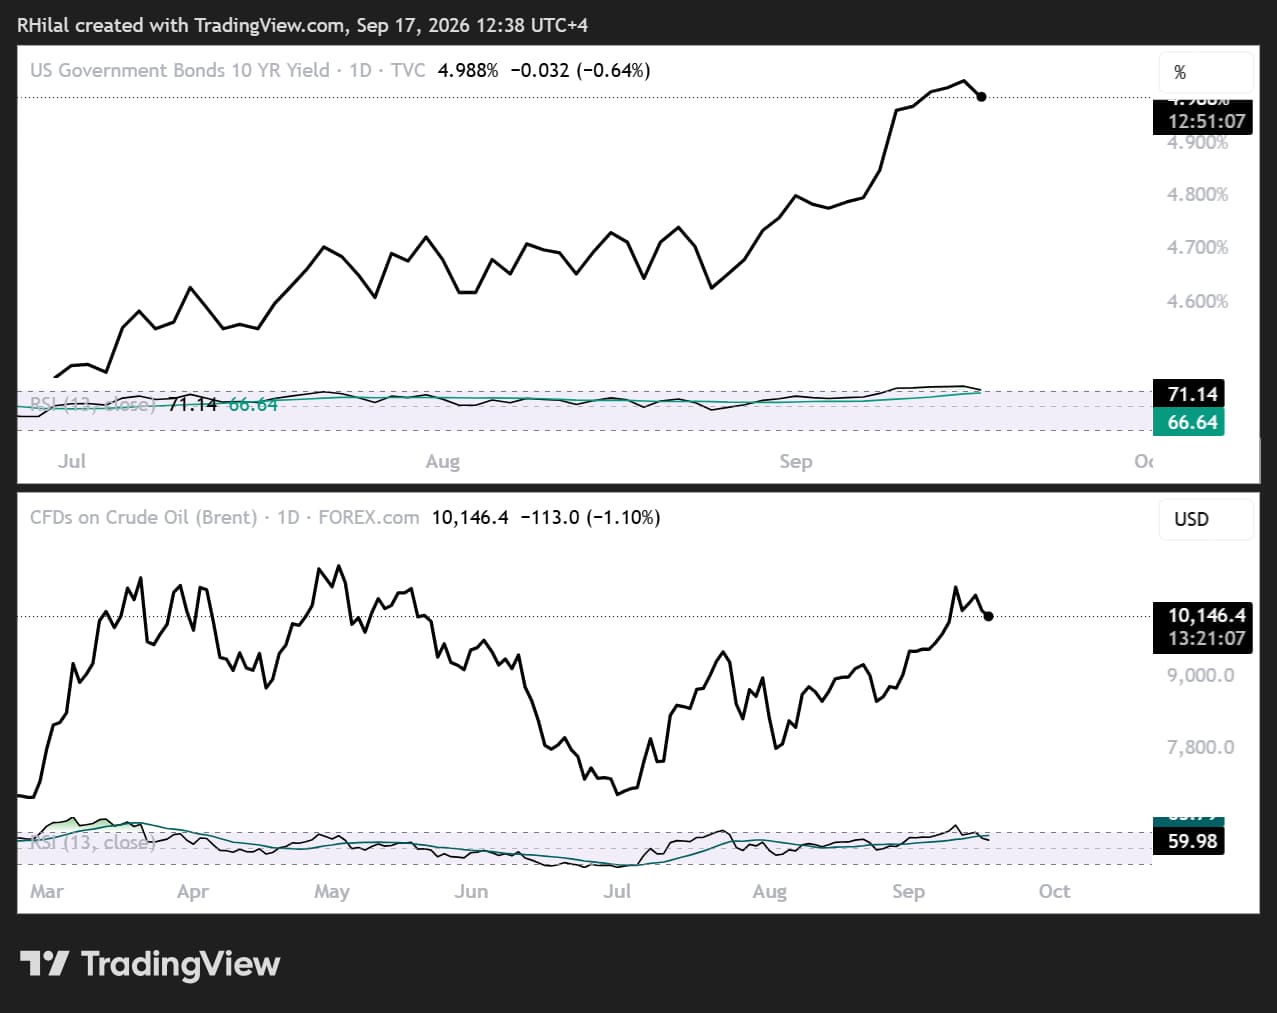
Source: TradingView
Although rate-hike expectations are limiting gains across currency markets, the broader narrative driving markets appears to be easing.
Crude oil prices and energy disruption risks are moderating, with Brent down more than 6% from its monthly highs. This signals a potential reversal in inflationary pressures.
At the same time, U.S. 10-year Treasury yields have pulled back from the 2007 resistance zone near 5.02%–5.3%. Daily overbought momentum has also weakened below its respective moving average.
This combination may help support risk appetite and prevent the charts from experiencing deeper drawdowns, particularly as they approach technically significant support levels.
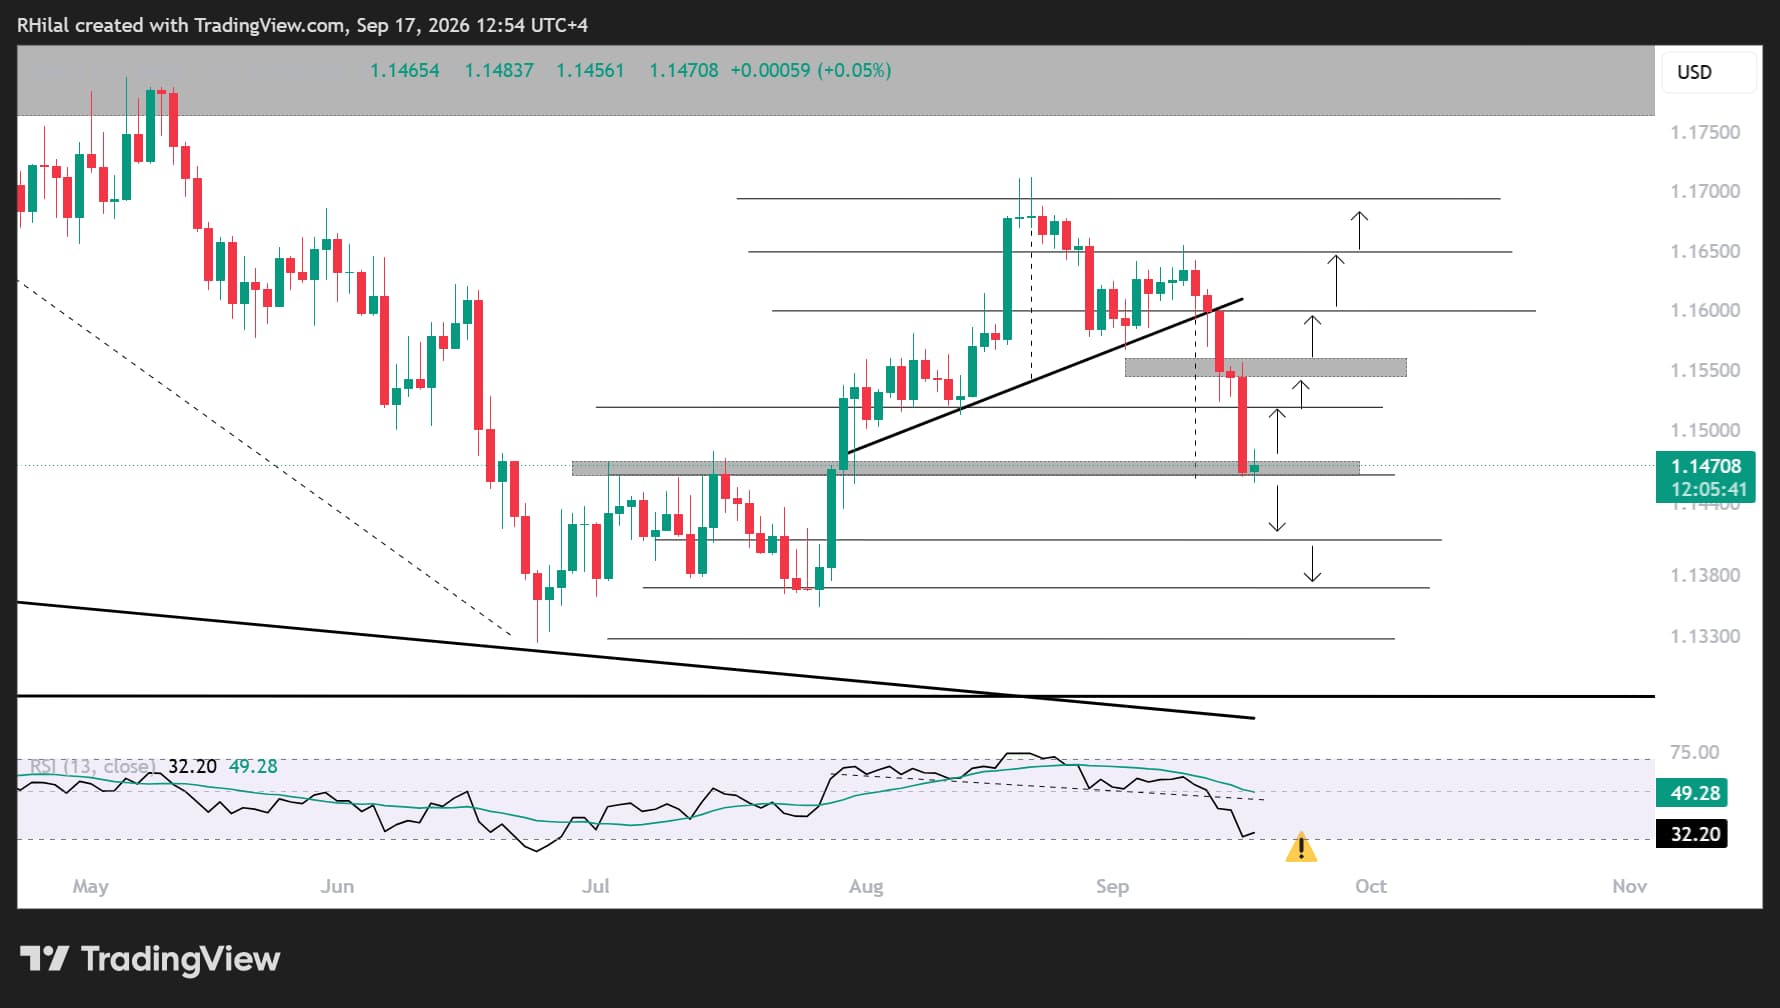
- For EUR/USD, the 1.1460 support level represents a defining barrier between the bullish and bearish biases.
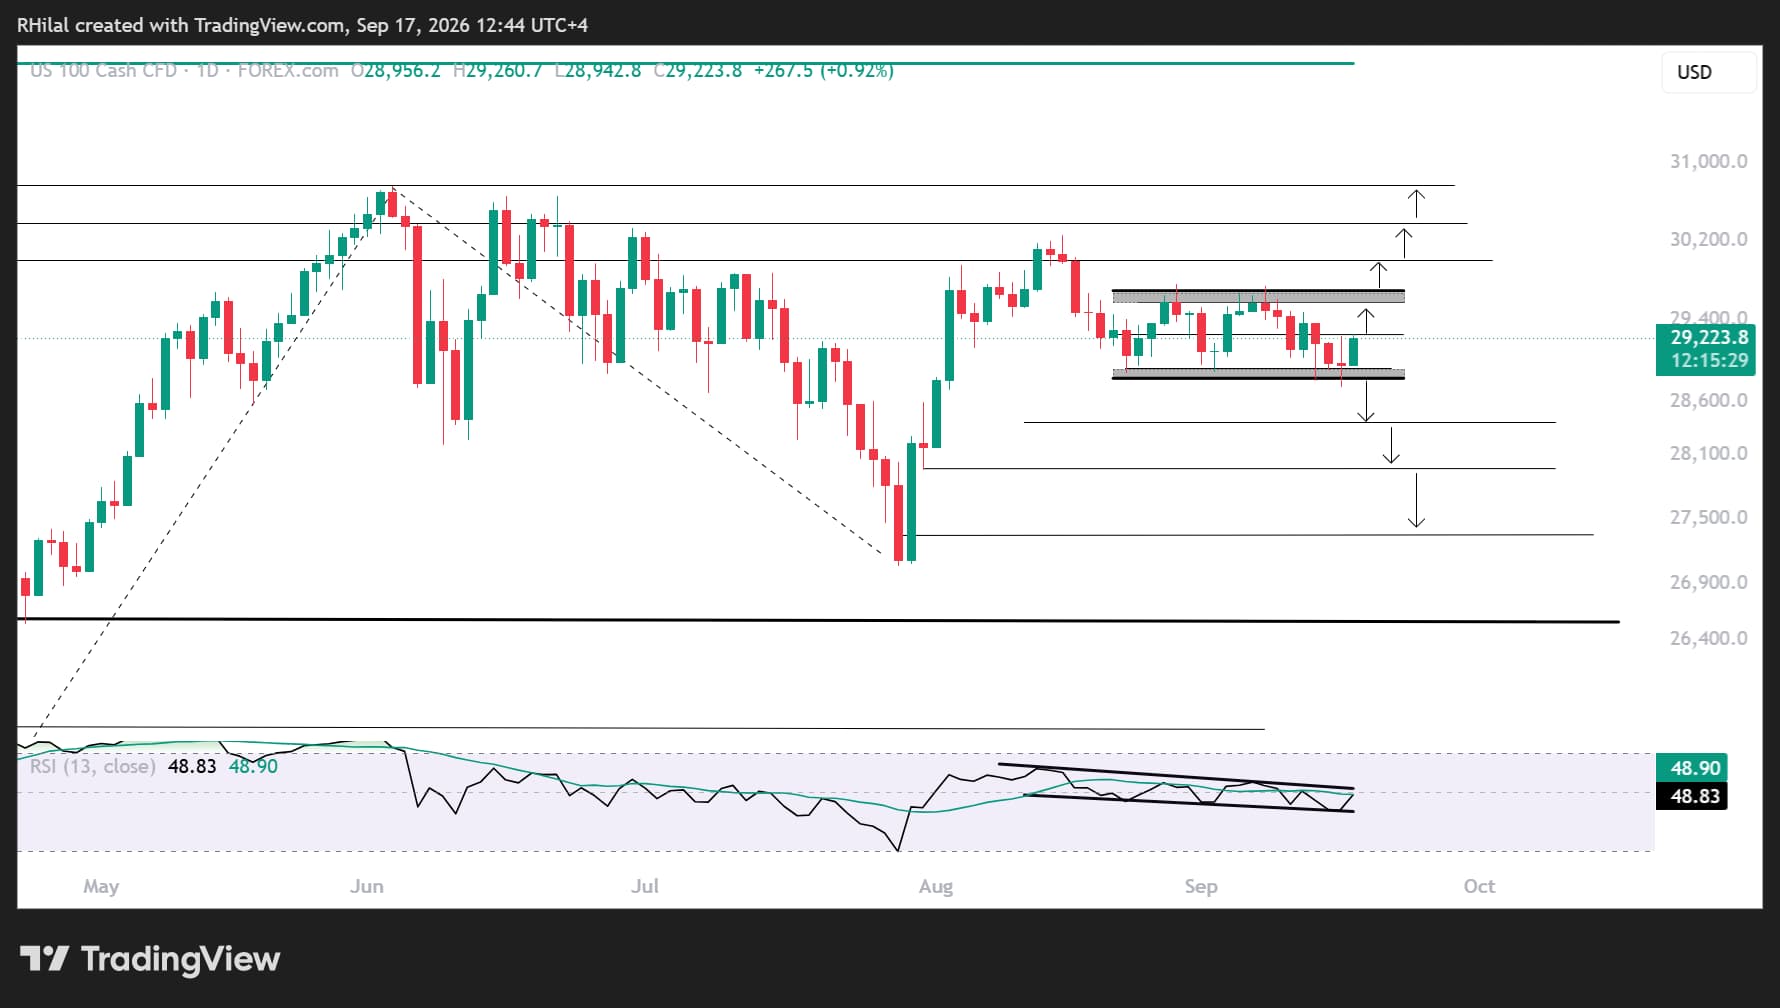
- For the Nasdaq, the key support level to watch is 28,800.
EUR/USD Price Outlook: Daily Time Frame — Log Scale
Source: TradingView
From a daily perspective, EUR/USD’s decline toward the 1.1460 area coincides with several technical developments:
- The target of the July–August head-and-shoulders pattern on both the price chart and the RSI.
- The 61.8% Fibonacci retracement of the July–August advance.
- Daily oversold momentum levels last seen in July 2026.
- The first wave of a potential impulse move between the July and August low and high.
These factors reinforce the potential for a bullish reversal. A clear move back above 1.1520, 1.1560 and 1.1600 would strengthen the bullish continuation outlook.
These levels align with the Fibonacci extension levels of the wave spanning July, August and September.
However, a breakdown and close below 1.1460 would expose 1.1400, 1.1370 and the yearly low at 1.1320, increasing the risk of a broader shift toward a long-term bearish outlook.
Nasdaq Price Outlook: Daily Time Frame — Log Scale
Source: TradingView
The Nasdaq is currently holding above its multi-week support near 28,800 despite facing several fundamental headwinds, including:
- AI security concerns related to Anthropic.
- Persistent inflation and Federal Reserve rate-hike risks.
At the same time, the role of artificial intelligence in supporting economic recovery, combined with the reversal in crude oil prices, may help reinforce the 28,800 support level.
This leaves two distinct scenarios in focus.
A breakdown below 28,800, which represents the 38.2% extension of the June–July–August wave, would target the 50% and 61.8% extension levels near 28,400 and 28,000, respectively.
A sustained move below these levels would increase the risk of a deeper drawdown toward 26,600, which aligns with the 100% extension.
The daily RSI remains within a multi-week consolidation but is tilted toward the bearish side, amplifying these risks unless price action reverses and closes above the upper boundary of the multi-week range near 29,800.
A close above 29,800 would reassert the bullish bias and open the way toward 30,000, 30,400 and the yearly highs near 30,800.
Such a scenario would require a renewed risk-on environment, a less hawkish Federal Reserve outlook, and a decline in Treasury yields and crude oil prices.
I analyze these charts in greater detail during my weekly webinars.
Register here for the next one.
Written by Razan Hilal, CMT
Follow on X: @Rh_waves






