


EUR/USD Falls to Fresh Monthly Low
The trend since Christmas Eve has been clear, with EUR/USD setting a consistent pattern of lower-lows and lower-highs. There’ve been a couple of stops along the way, such as last week’s bounce from the 1.1616 level and, before that, a bounce rom a prior point of resistance at 1.1656. But, so far, each rally has been sold aggressively, and bears have continued to exhibit control of the trend, punctuated with this morning’s push down to a fresh monthly low.

At this point price is testing the 38.2% Fibonacci retracement of the May-September major move from last year at 1.1593. Notably, the 50% mark of the same Fibonacci setup plots at 1.1492, which had caught the swing-low on November 21st before EUR/USD went into rally mode and drove up to a failed test of the 1.1800 handle.
EUR/USD Four-Hour Price Chart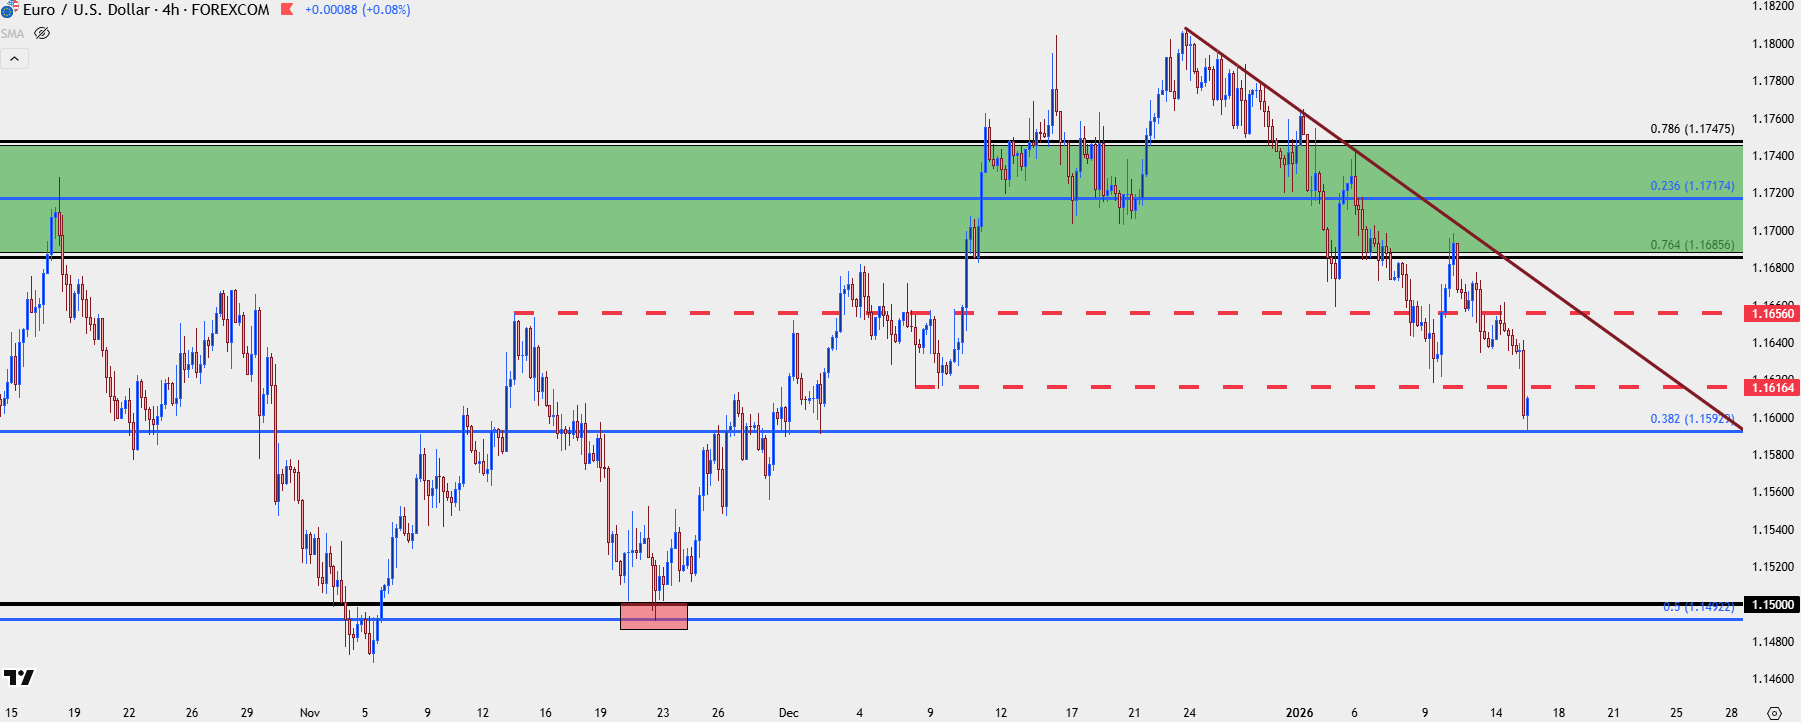
Chart prepared by James Stanley; data derived from Tradingview
EUR/USD: Big Picture Ramifications
I’ve been talking about this for a few months now but for EUR/USD, it’s the 1.1500 level that’s of such importance. Like we saw back in November, sellers were able to elicit a test of that level but they couldn’t leave it behind. Historically speaking, this is a significant spot for the pair, as the world’s two most popular currencies have shown a tendency to hold or at least slow trends when interacting with that 1.1500 handle. Even an episode such as 2021-2022, when the US was readying to hike rates, it took the pair about 4-5 months to finally leave 1.1500 behind, and that’s when there was a rather clear fundamental driver. In the heat of the Covid pandemic getting priced-in, it was 1.1500 that helped to mark the top in the pair. And then for a two-plus year period in 2015 through the 2017 open, 1.1500 marked range resistance on multiple occasions.
The reason that a round level like 1.1500 can be so impactful draws back to the usage of currencies, from global central banks or multi-national treasury departments. These players can have a forceful role in the FX market and they’re not necessarily looking to speculate for a few pips with the use of leverage; instead, they have to make payroll or manage reserve baskets, and the tests of these major psychological levels can bring on perceived value, leading to reaction, which then leads to a resistance (or support) hold.
EUR/USD Monthly Price Chart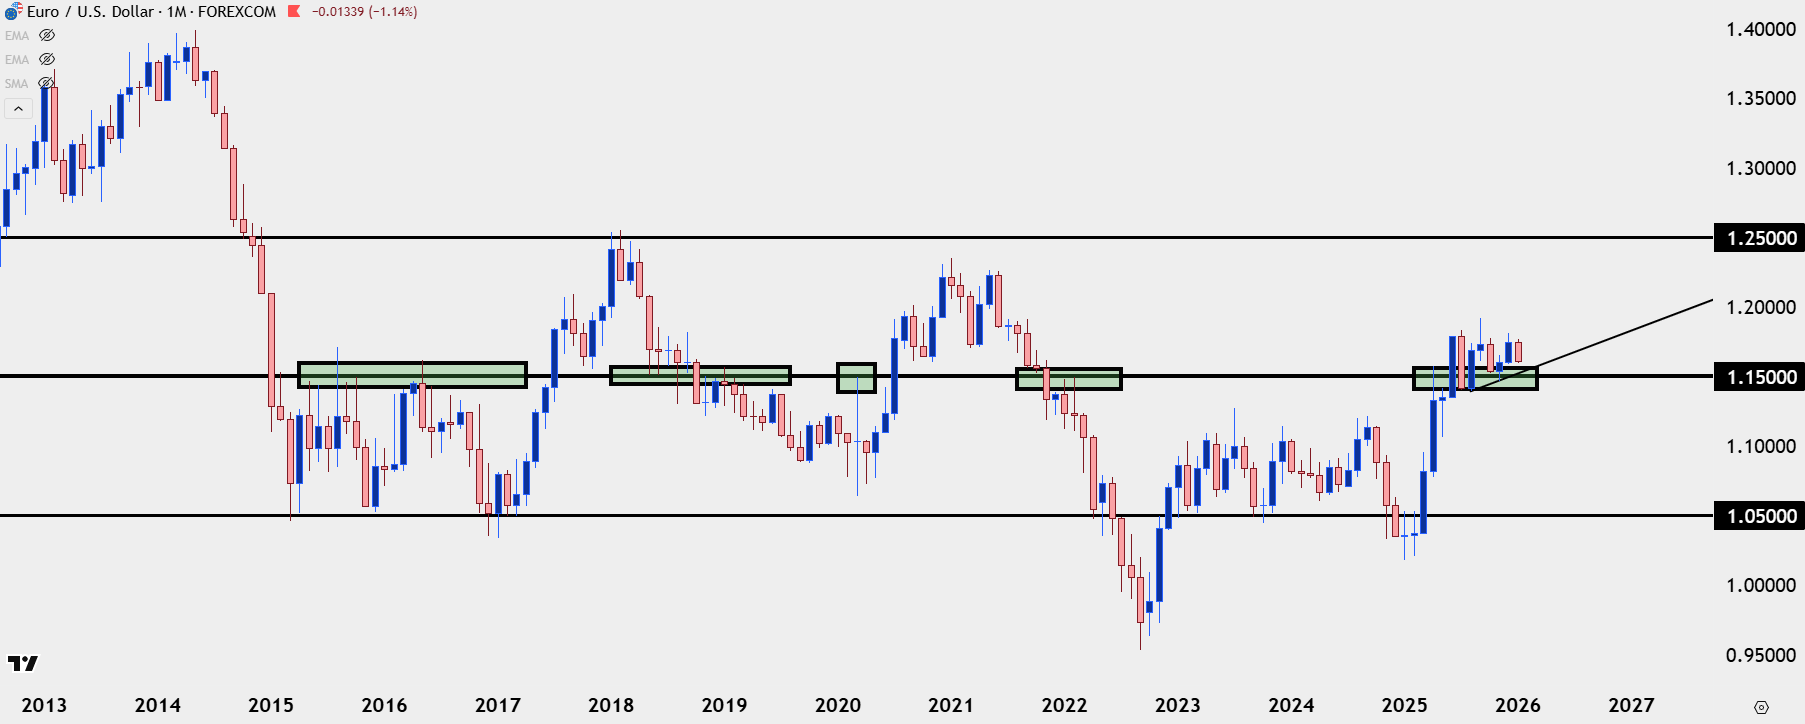
Chart prepared by James Stanley; data derived from Tradingview
EUR/USD Strategy
Does this all mean that 1.1500 is unlikely to get broken? Not necessarily, as the above chart illustrates numerous instances where that did take place. More than anything, I wanted to draw back to the fact that it often takes time for a level like 1.1500 to give way, and that’s what began to get tested in the second-half of last year which keeps the door open for another test.
It does, however, highlight the danger of chasing on that re-test of 1.1500 as there’s been a propensity for that price to produce pullbacks so far, so for traders that do want to push the short side of the pair, pullbacks and trend continuation setups would likely be the more attractive way forward until evidence presents that 1.1500 might give way.
For now, this puts the focus on those prior points of support, such as 1.1616 or 1.1656 for short-term strategies. Or, for longer-term perspectives, the 1.1686-1.1748 Fibonacci zone, which has been a major stumbling block for bulls for more than six months now.
EUR/USD Two-Hour Chart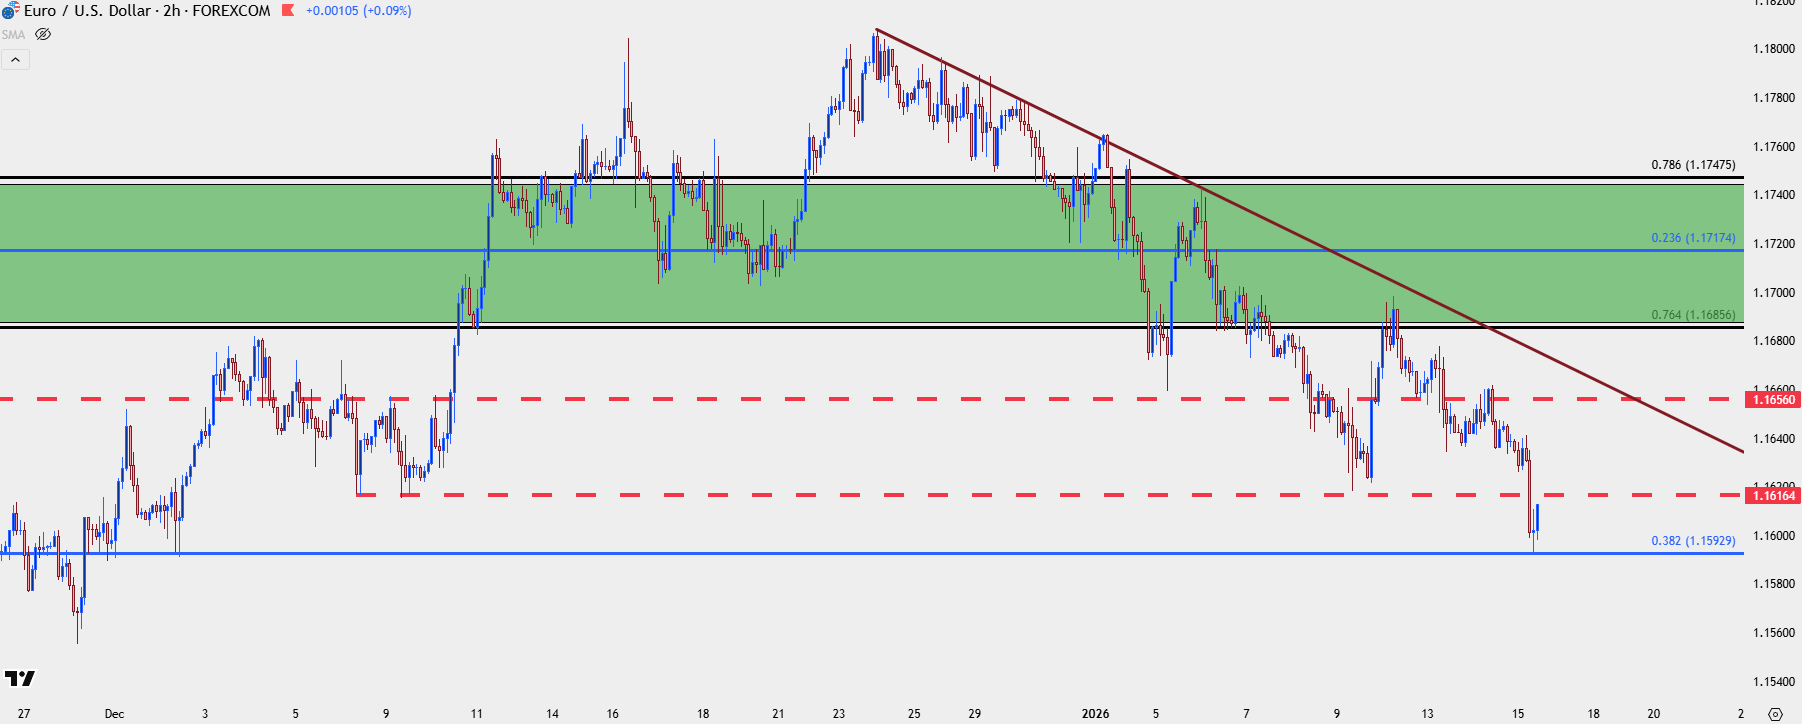
Chart prepared by James Stanley; data derived from Tradingview
--- written by James Stanley, Senior Market Analyst, Global Macro






