


Double top and bottom scenarios can be seen on the US Dollar Index and EURUSD charts, as price action holds in consolidation in tandem with crude’s hold near $90. With no resolution in sight, further market drawdown risks are building.
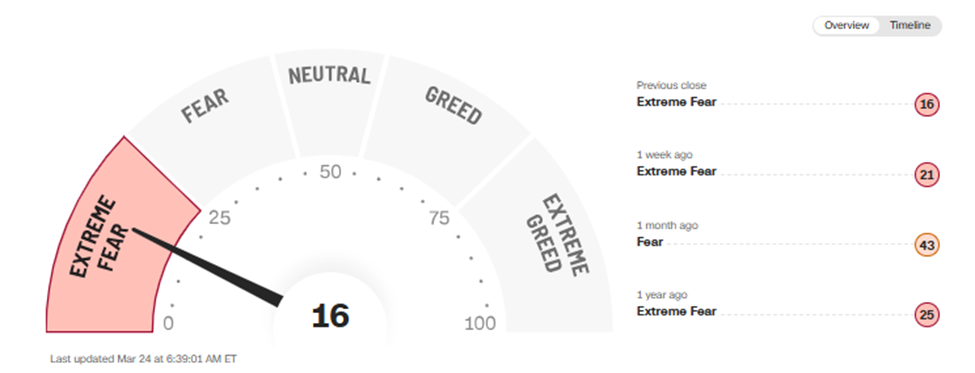
CNN Fear and Greed Index
Source: CNN
The index dropped to 10 yesterday, marking extreme fear levels last seen in April 2025 amid reciprocal tariff rhetoric, keeping bearish scenarios intact.
Trump’s comments regarding positive negotiations with Iran, including a potential postponement of strikes on key power plants, briefly lifted market sentiment. However, this move was quickly reversed following Iran’s denial of such developments.
As a result, sentiment remains firmly in bearish territory, with the index only recovering marginally from 10 to 16. Key levels remain in focus to confirm any meaningful structural shifts on the crude, dollar, and EURUSD charts, whether for dip-buying opportunities or trend-following setups.
Key Levels to Watch:
• DXY: 100.50 resistance, 98.80-98 support
• EURUSD: 1.1660 resistance, 1.14 support
DXY Monthly Outlook – Log Scale

Source: Trading View
The broader view for the index from the 2008 low remains bullish, as price action holds above the 96 mark and the lower bound of the respected 18-year channel. A possible double bottom formation can be seen extending on the chart between the lows of June 2025 and January 2026, testing the 100.50 neckline.
Bullish scenario:
Closing back above 99.50 and 100.50 exposes the index to a bullish breakout towards the 101.80 and 104.40 marks, completing a double bottom reversal target. This scenario would likely coincide with Middle East conflict escalations, leading to further disruptions in oil supply routes and facilities, contributing to higher inflation risks and more hawkish rate policies.
Bearish scenario:
Closing back below the 98.80 mark extends bearish forecasts down towards the 98.50 and 98 marks for a potential bullish hold. If not, a deeper retracement exposes the index to another test of the channel’s borders near the 96 zone, reinforcing either another bullish rebound or a long-term bearish breakout. This scenario would likely coincide with US–Middle East conflict de-escalation and oil price unwinds.
EURUSD 2-Week Outlook – Log Scale
Source: Trading View
The analysis on EURUSD is quite similar to the DXY, on the inverse. There is consolidation below the 1.20 mark extending on the charts between June 2025 and January 2026, taking the shape of a possible double top pattern formation.
Bearish scenario
Closing below the double top neckline at the 1.14 zone exposes the pair to an extended drawdown back towards the upper bound of a respected down trending channel since the highs of 2008, near the 1.12–1.11 zone, for a dip-buying opportunity. Falling back below this zone and within the bounds of this channel reinforces longer-term dominance for the dollar against the euro once again. This scenario aligns with the DXY’s bullish scenario mentioned earlier.
Bullish scenario
Closing back above the 1.1660 level extends gains towards the 1.1760 and 1.1860 marks, re-exposing the pair to further upside towards the 1.20 mark and potentially towards the 2022 and 2018 highs near 1.23 and 1.25.
Written by Razan Hilal, CMT
Follow on X: @Rh_waves






