
The trading week is almost over and, so far, EUR/USD has started to show a three-session bearish streak, accumulating a loss of more than 0.8% in the short term. This behavior has begun to reflect a relevant bearish bias once again, driven by the continued recovery in US dollar strength, leaving the euro in a weaker short-term position.
Selling pressure remains in place as recent data continues to show persistent inflationary pressures in the US economy. This event may point to a more aggressive Federal Reserve over the coming months, which, to some extent, has helped the US dollar regain strength in the short term. If this effect remains in place, selling pressure may continue to be relevant over the coming trading sessions.

Inflationary pressures begin to gain relevance
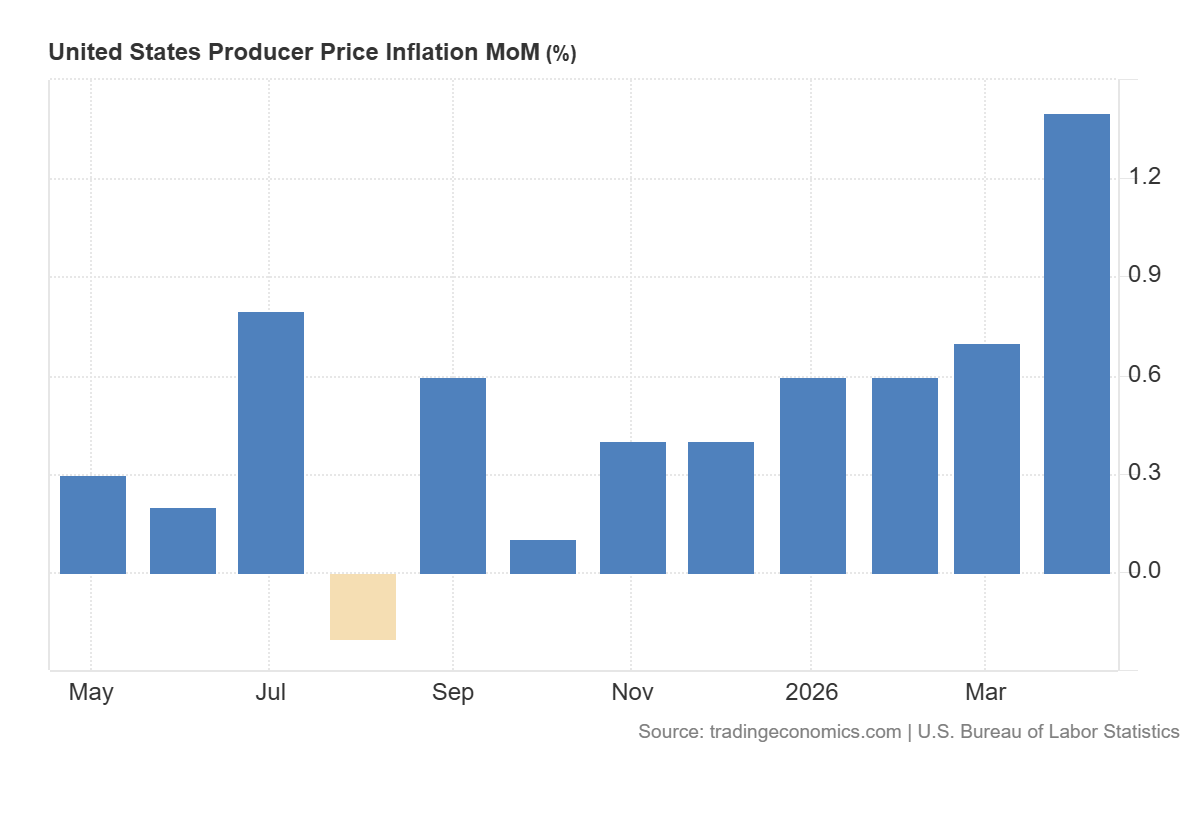
At the beginning of the week, inflationary pressures had already started to stand out with the release of US CPI inflation data. However, during yesterday’s session, PPI m/m data was also released, showing the change in producer prices in the US economy compared to the previous month. In this case, the context has become more concerning, as an initial reading of 0.5% was expected, but the official figure came in at 1.4%, well above market expectations.
The latest PPI reading represents the highest percentage increase of the year and highlights that not only has this indicator been moving higher in recent months, but the pace of increase has also started to accelerate more than expected. This means that inflationary pressures in the US economy may be even more relevant than what the market had been trying to price in just a few weeks ago.
Source: TradingEconomics
Taking all of this into account, the scenario of a potentially more aggressive central bank in the United States has started to gain increasing relevance, as the Federal Reserve is now expected to adjust its outlook for the next monetary policy decisions, leaning toward a more restrictive approach over the coming months.
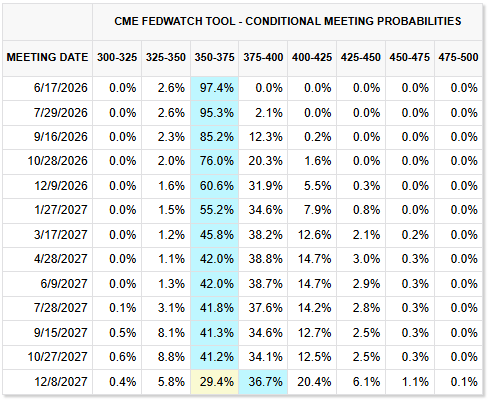
In fact, looking at the Federal Reserve probability table, the market is already beginning to price in a more aggressive central bank scenario for the coming months. Although there is still a probability above 70% that interest rates remain at the current 3.75% level through October 2026, this stability outlook has begun to shift toward a scenario in which the central bank could even move toward raising interest rates.
The probability for December 2026 already shows a little more than a 30% chance that the decision toward the end of the year could be to raise rates at least toward the 4.00% reference level. In addition, this probability of rate increases has been growing steadily for the first months of 2027. This event is quite relevant considering that, only a few months ago, there was no scenario pointing to potential rate hikes toward the end of 2026 or the beginning of 2027. This reflects that the market now expects the Federal Reserve to potentially shift from being a central bank that waits and maintains stability to an institution that could become more aggressive over the coming months.
Source: CMEGROUP
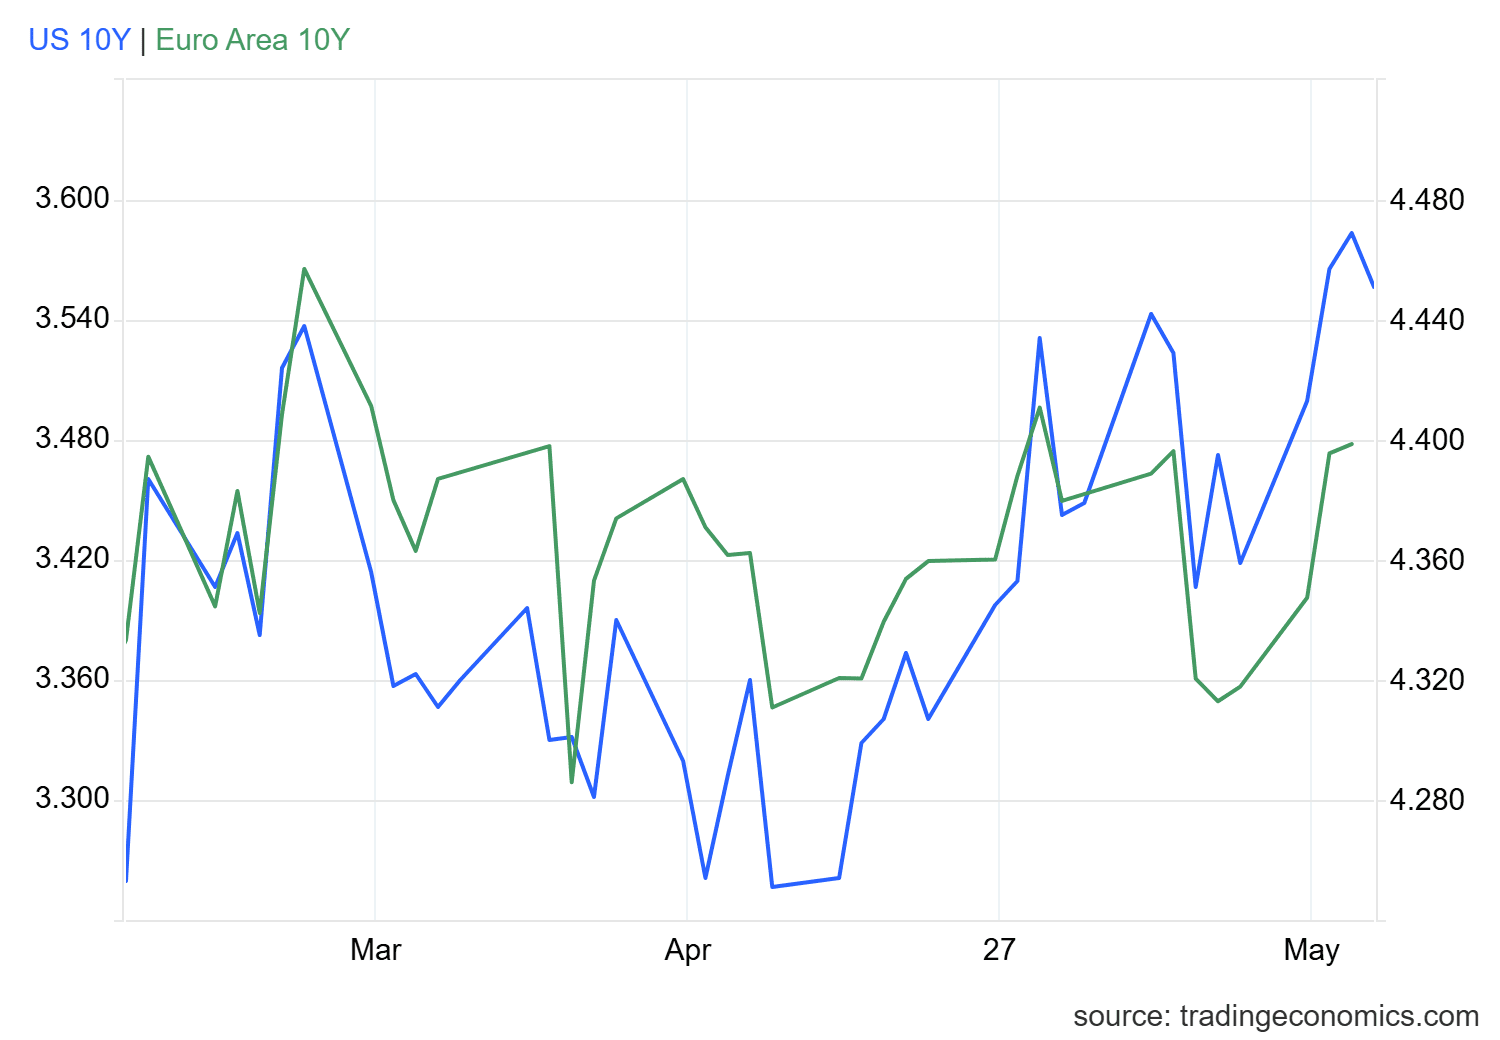
The scenario of a potentially more restrictive central bank continues to generate an important advance in US bond market yields, which continue to maintain a competitive advantage over European bonds in the short term. Now, US Treasury yields continue to show a strong upward slope and are trading near 4.5%, a zone not seen since July 2025, reflecting a relevant increase in bond market returns.
Although the outlook in Europe also points to higher yields, with rates approaching 3.5%, the differential continues to favor the United States. If US bonds maintain higher yields and a more aggressive Fed outlook, demand for USD-denominated securities could continue to gain attractiveness in the short term.
Source: TradingEconomics
Taking all of the above into account, the dynamic remains similar: economic data continues to show relevant inflationary pressures and points to a potentially more aggressive central bank over the coming months. This helps US bond yields maintain steady growth and a comparative advantage over other markets.
In the long run, this behavior may be creating an effect of foreign capital inflows seeking exposure to 10-year Treasury bonds and, therefore, may be stabilizing consistent demand for US dollars in the short term. This makes it difficult for the euro to sustain a recovery scenario and could continue to keep potential selling pressure relevant in EUR/USD over the coming sessions.
Technical outlook for EUR/USD

Source: StoneX, Tradingview
- New trendline may be at risk: Since mid-March, EUR/USD has been forming a sequence of higher lows, giving way to the potential formation of a short-term bullish trendline. However, recent weakness in price action has started to move increasingly closer to the area marked by this bullish trend line. If selling pressure manages to remain consistent, this could lead to a break of the current trendline that is attempting to support price, potentially opening the door to a more relevant bearish bias.
- RSI: The RSI indicator has started to shift consistently, as the indicator line is currently showing movements below the neutral 50 level. This means that the average momentum over the last 14 sessions has started to show relevant bearish dominance, which could continue to be part of EUR/USD price action in the short term.
- MACD: A similar scenario has started to appear in the MACD indicator, as the histogram is showing movements below the 0 line. This reflects that bearish strength has started to become part of the average strength of short-term moving averages, also highlighting the potential emergence of a relevant selling bias in the market, which could remain important over the coming sessions.
Key levels:
- 1.18056 – Relevant resistance: A level corresponding to current highs, positioning itself as the most important bullish barrier to watch. Price movements above this area could open the door to new highs and consolidate short-term buying strength, extending the current bullish trendline in the coming sessions.
- 1.16686 – Near-term barrier: A neutral level that coincides with the 50- and 200-period moving averages, positioning itself as one of the most relevant areas to monitor in the short term. Movements near this level could reinforce a sideways phase and increase market indecision in the coming sessions.
- 1.15904 – Definitive support: A level located below the moving averages that acts as a relevant retracement area. Movements toward this level could put the current bullish structure at risk and activate a more consistent selling bias in the coming weeks, which would cause a shift in the chart’s dynamic, where bullish strength would begin to lose relevance.
Written by Julian Pineda, CFA, CMT – Market Analyst
Follow him on: @julianpineda25