


British Pound Outlook: GBP/USD
The recent recovery in GBP/USD curbs the threat of a head-and-shoulders formation as it trades back above the 50-Day SMA (1.3502), but the exchange rate may track the flattening slope in the moving average should it give back the advance from last week’s low (1.3399).
GBP/USD Recovery Curbs Threat of Head-and-Shoulders Formation
GBP/USD seems to be stuck in a narrow range after registering a fresh monthly high (1.3595) during the previous week, and the exchange rate may continue to consolidate as it pulls back ahead of the July high (1.3789).
UK Economic Calendar
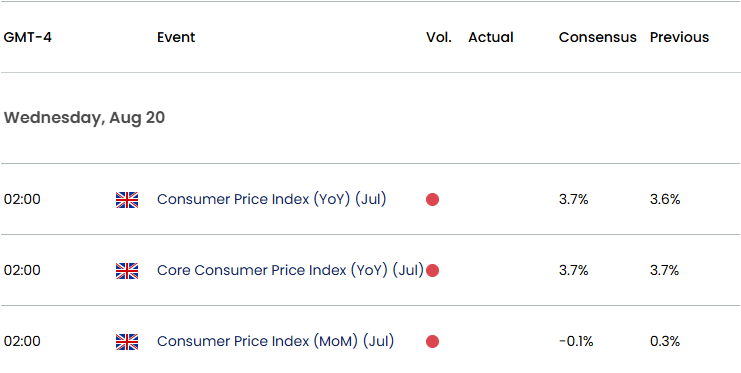
Nevertheless, the update to the UK Consumer Price Index (CPI) may sway GBP/USD as the headline reading is seen widening to 3.7% in July from 3.6% the month prior, and signs of persistent price growth may push the Bank of England (BoE) to the sidelines following the 5-4 split to implement a 25bp rate-cut at the August meeting.
Join David Song for the Weekly Fundamental Market Outlook webinar. David provides a market overview and takes questions in real-time. Register Here
In turn, the range bound price action in GBP/USD may turn out to be temporary as the BoE continues to combat inflation, but a softer-than-expected UK CPI report may drag on the British Pound as it puts pressure on Governor Andrew Bailey and Co. to implement lower interest rates.
With that said, GBP/USD may struggle to retain the advance from the monthly low (1.3142) as the BoE acknowledges that ‘a gradual and careful approach to the further withdrawal of monetary policy restraint remains appropriate,’ but the exchange rate may attempt to further retrace the decline from the July high (1.3789) as it appears to be negating a potential head-and-shoulders formation.
GBP/USD Price Chart – Daily
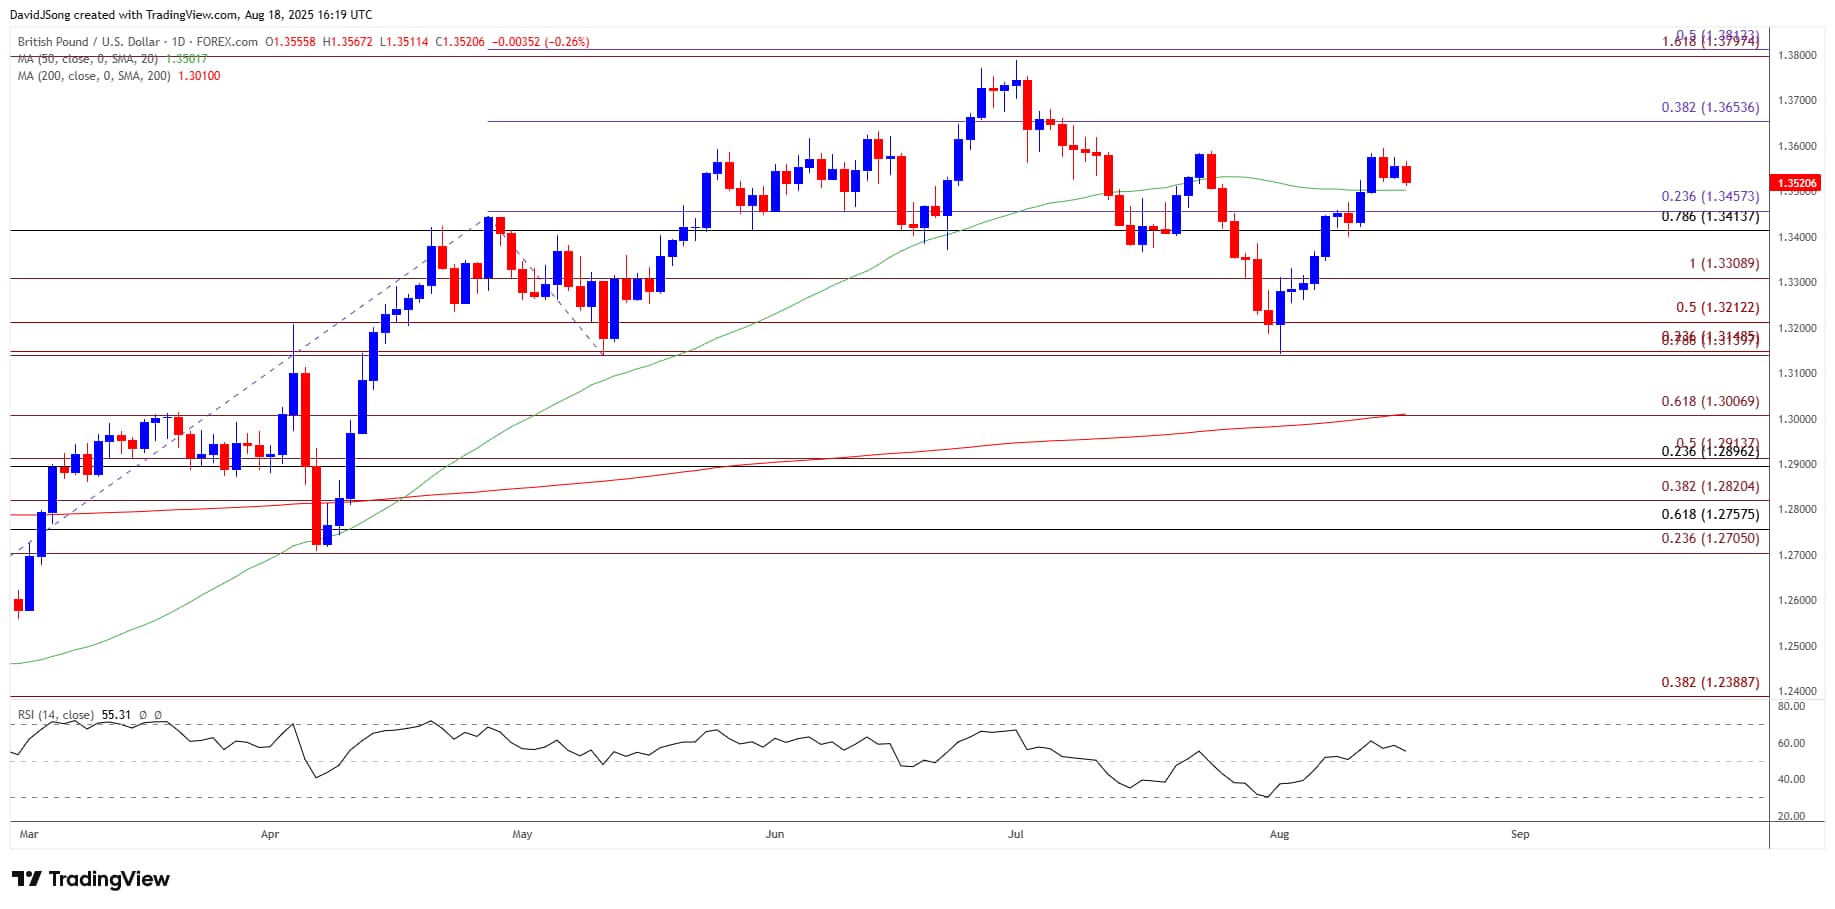
Chart Prepared by David Song, Senior Strategist; GBP/USD on TradingView
- GBP/USD may defend the advance from last week as it holds above the 50-Day SMA (1.3502), and a move/close above 1.3650 (38.2% Fibonacci extension) may lead to a test of the July high (1.3789).
- A move/close above the 1.3800 (161.8% Fibonacci extension) to 1.3810 (50% Fibonacci extension) region brings the September 2021 high (1.3913) on the radar, but lack of momentum to hold above the 1.3410 (78.6% Fibonacci retracement) to 1.3460 (23.6% Fibonacci extension) zone may push GBP/USD toward 1.3310 (100% Fibonacci extension).
- Failure to hold above 1.3210 (50% Fibonacci extension) may lead to a test of the monthly low (1.3142), with a move/close below the 1.3140 (78.6% Fibonacci extension) to 1.3150 (23.6% Fibonacci extension) region opening up 1.3010 (61.8% Fibonacci extension).
Additional Market Outlooks
US Dollar Forecast: EUR/USD Eyes Monthly High
US Dollar Forecast: USD/CHF Recovers from Fresh Monthly Low
Australian Dollar Forecast: AUD/USD Climbs to Fresh Monthly High
USD/JPY Pulls Back from Fresh Weekly High as US CPI Holds Steady
--- Written by David Song, Senior Strategist
Follow on Twitter at @DavidJSong







