
Will Hormuz inflation risks trigger a breakout this week following the sharp surge in US CPI and escalating tensions between the US and Iran after a stalemate in weekend negotiations?
Key Market Drivers
- US CPI y/y surged from 2.4% to 3.3% on Friday, marking the sharpest increase since 2025
- Hormuz tensions are escalating, with the US ordering a naval blockade on Iran, triggering renewed Iranian threats targeting Gulf ports
- Diverging narratives between the US and Iran regarding conflict resolution are likely to support short-term dollar strength and broader market weakness
- Eurozone CPI was the first to signal inflationary pressures, rising back above 2%, reinforcing expectations for tighter monetary policy as elevated energy prices persist
- UK CPI for March is due next week, currently near 3%, adding to inflation concerns amid what is one of the most significant energy shocks in recent history, supporting expectations for a more hawkish Bank of England alongside the ECB if tensions persist
From a Technical Angle
DXY Price Outlook: Weekly Time Frame – Log Scale
Source: Trading view
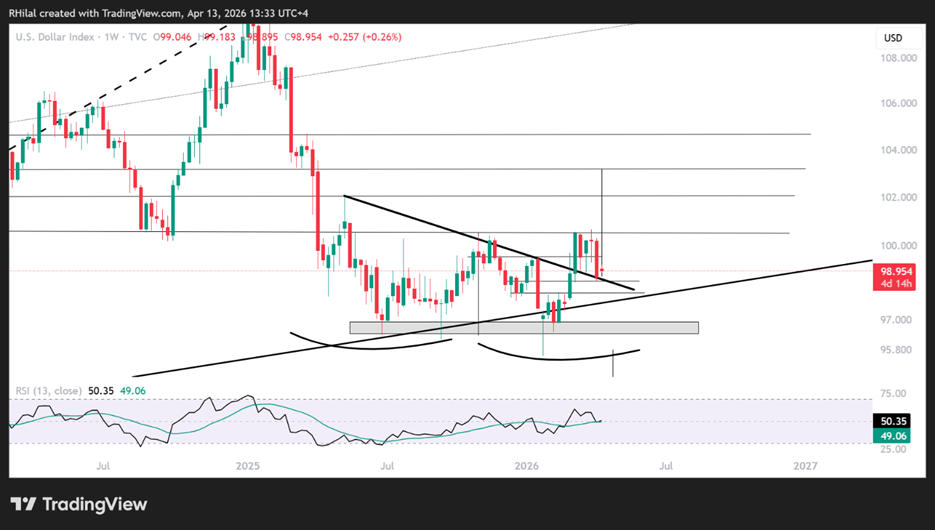
The DXY remains in a consolidation phase, caught between rising inflation expectations, driven by higher energy prices, and hopes that ceasefire negotiations could ease these pressures.
From a technical perspective, this is reflected in the 100.60 resistance and the 98.50–98 support zone.
Bullish Scenario
Price action suggests the formation of a double bottom pattern, with a descending neckline limiting upside attempts near the 100 level.
A confirmed close above 100.60 could open the path toward 101.80 and 104.60, extending downside pressure on major currencies and precious metals.
The bearish scenario is explained with the monthly time frame below
DXY Price Outlook: Monthly Time Frame – Log Scale

Source: Trading view
Alternative Scenario
A break below the 98 level would invalidate the double bottom structure, exposing the index to the 97–95 support range, aligned with the broader 2008–2026 uptrend. This zone remains critical in defining the longer-term directional bias for the dollar.
GBPUSD Price Outlook: Weekly Time Frame – Log Scale
Source: Trading view
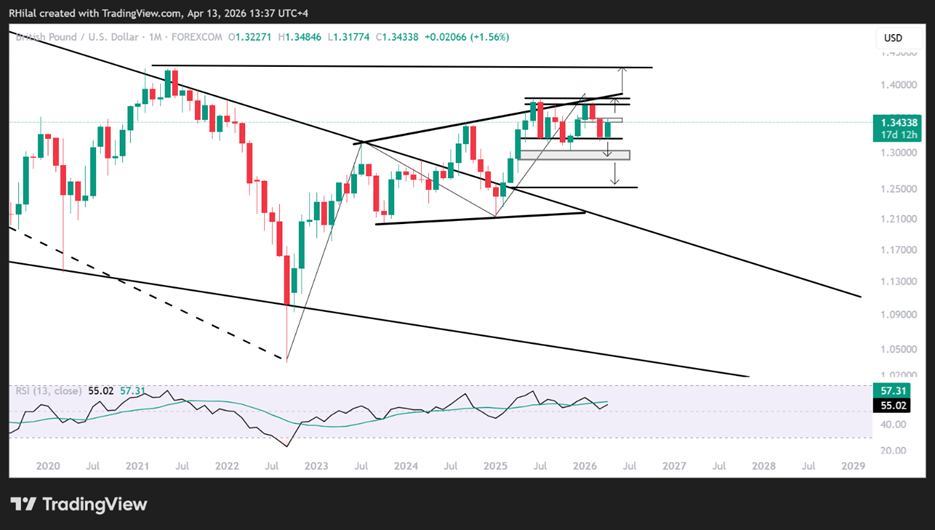
Similar to EURUSD, GBPUSD may be forming a double top pattern, opposing the DXY’s potential double bottom. The pair is struggling below the July 2023–January 2026 resistance zone near 1.38, while consolidating above the 1.32–1.30 support range.
Bullish Scenario
A move above the 1.3480 high could support a push toward the 1.37–1.3780 zone. A sustained break above 1.38 would strengthen the broader outlook toward 1.40–1.42.
Bearish Scenario
A break below 1.30 could expose downside toward 1.29 and 1.25, where potential recovery interest may emerge.
With sentiment heavily driven by headlines, focusing on confirmed closes beyond long-term key levels remains essential to minimize noise and avoid bull and bear traps.
Written by Razan Hilal, CMT
Follow on X: @Rh_waves