


Key Events
- Trump’s accusations against Fed Governor Cook shake market sentiment
- U.S. Dollar Index holds near 98 as Trump–Fed tensions rise
- Legal uncertainty weighs on Bitcoin (now below 110,000) and indices (down over 0.5% this week), while gold maintains its bullish-to-neutral tone near $3,370
Powell’s dovish stance on Friday initially lifted sentiment, but Trump’s legal move against Fed Governor Cook pulled markets back into risk-off mode. Gold remains supported by its haven status and continues to consolidate within its five-month range, holding above $3,320.
Meanwhile, indices and cryptocurrencies are struggling to sustain momentum as legal uncertainty unfolds. Bitcoin is under pressure, falling below $110,000 and raising the risk of a broader crypto market reversal. Nasdaq also failed to break above the 23,500 resistance, signaling fading risk appetite in tech-led sectors ahead of tomorrow’s NVIDIA earnings report.
Technical Analysis: Quantifying Uncertainties
Gold Daily Time Frame – Log Scale
Source: Tradingview
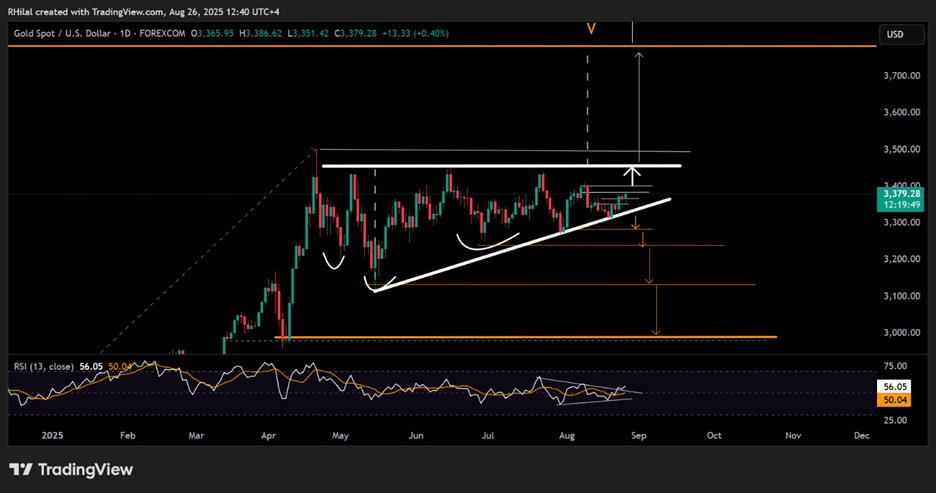
From a daily time frame perspective, gold continues to consolidate, holding in a bullish-to-neutral structure as market uncertainty grows and ventures into uncharted territory. The price is currently challenging the $3,380 resistance for further bullish confirmation. Near-term levels in sight to confirm a bullish breakout remain at 3,400 and 3,450. On the downside, support holds at $3,320 before confirming deeper pullback risks toward $3,280, $3,260, and potentially lower levels, as outlined in the following monthly time frame.
Gold Monthly Time Frame – Log Scale
Source: Tradingview
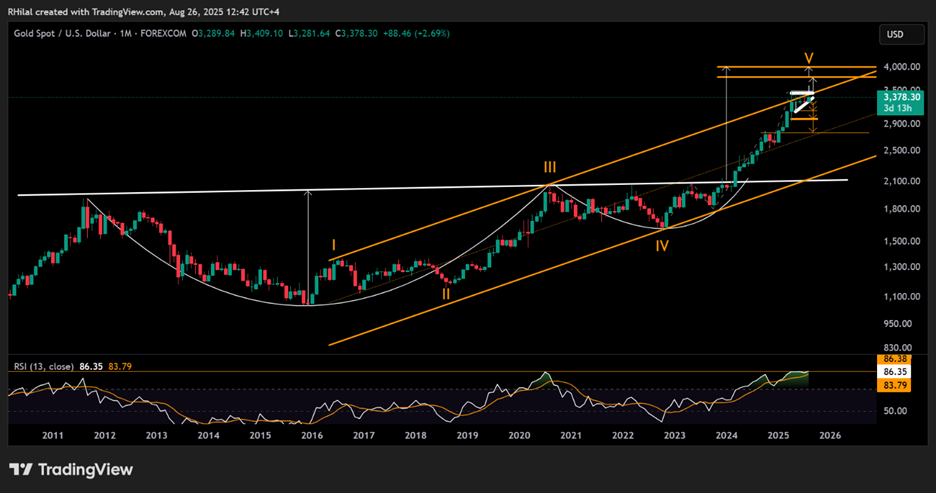
From a monthly time frame perspective, the gold chart remains in line with a cup and handle formation. It is currently aligned with resistance near the 2016–2020 trendline and continues to trade within a five-month consolidation. A clean breakout above 3,450 and 3,500 is needed to confirm the track toward the 3,780 and 4,000 checkpoints.
On the downside, if the lower boundary of the consolidation breaks below 3,320, 3,280, and 3,240, an extension toward 3,130 and the 2,900–2,800 zone could follow. This area aligns with the mid-zone of the long-term uptrend channel that has been respected since 2016 and may offer another opportunity for long-term bullish positioning. The longer the consolidation may extend, the stronger the breakout may be.
Bitcoin Daily Time Frame – Log Scale
Source: Tradingview
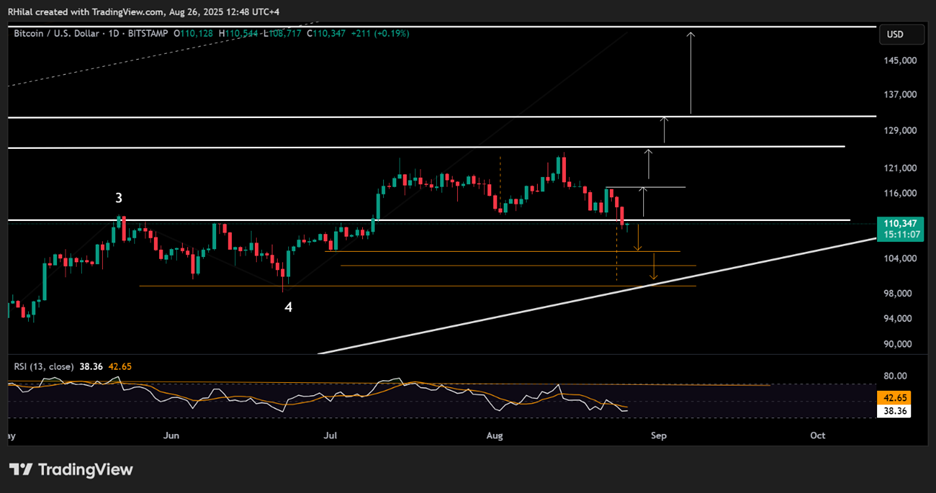
From a daily time frame perspective, a double top pattern near the 125,000 resistance may be unfolding. A confirmed break and sustained hold below the 110,000 level could extend bearish pressure toward the pattern’s projected targets near 104,000 and 98,000. These levels align with the trendline connecting higher lows from November 2022.
On the upside, if the trend closes back above 117,000, the double top pattern may be invalidated, setting the stage for a potential bullish continuation. A further confirmation above 125,000 would increase confidence in a forecast targeting 135,000 and 150,000.
The trendline and price channel extending from the 2022 lows are illustrated on the weekly time frame below.
Bitcoin Weekly Time Frame – Log Scale

Source: Tradingview
Written by Razan Hilal, CMT
Follow on X: @Rh_waves






