
XAU/USD has now recorded four consecutive bullish sessions in the short term, maintaining a gain of approximately 5.4%. The metal has even attempted to consolidate near the $4,200 per ounce level. The buying pressure seen in recent sessions has remained firm, supported by expectations of a more accommodative monetary policy from the Federal Reserve, which has weakened the U.S. dollar and boosted gold demand. If this outlook persists, the bullish momentum could become even more dominant in the coming sessions.

Could Lower Interest Rates Benefit Gold?
With less than a month remaining before the Federal Reserve’s monetary policy decision scheduled for December 10, the CME Group’s probability model shows that the market still expects a 0.25% rate cut, which would lower the benchmark rate from 4.00% to 3.75%. Although a month ago the probability of such a cut exceeded 90%, it has since moderated to 65%, yet still reflects a strong market expectation of a rate reduction by year-end during the Fed’s next meeting.
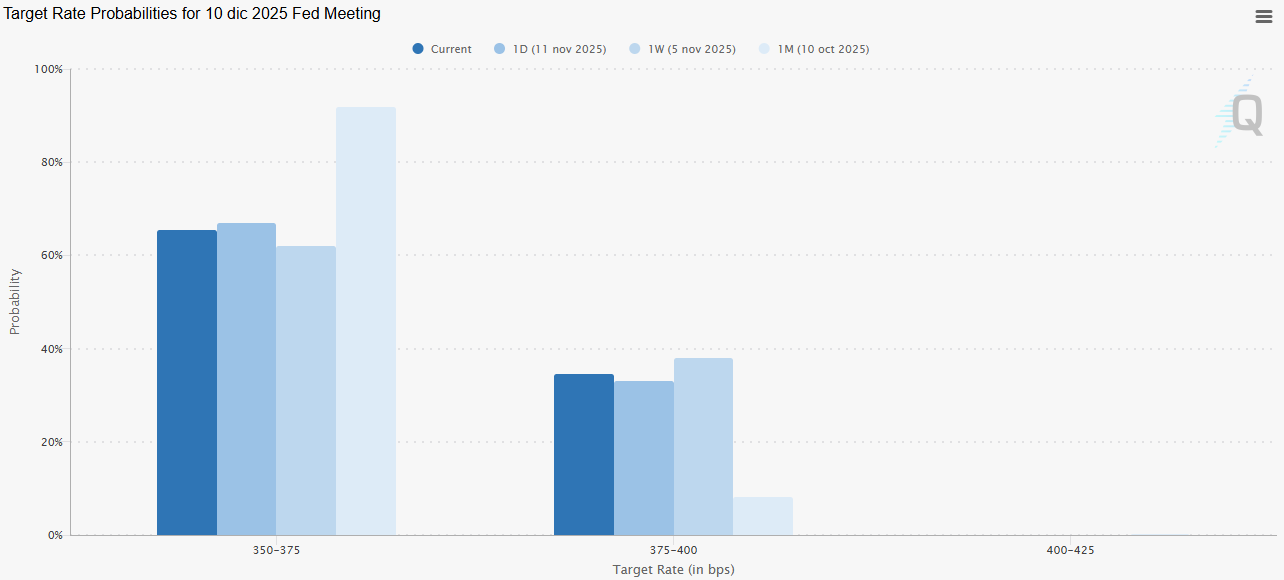
Source: CMEGROUP
This scenario has once again increased gold’s appeal relative to U.S. Treasury bonds, whose yields have declined toward the 4.00% area. As bond yields fall amid expectations of lower interest rates, gold has regained its position as a preferred safe-haven asset, benefiting from investors’ search for stability and diversification. Although gold does not generate interest, it tends to perform well when bond yields decrease, as investors often shift capital from fixed-income markets to the precious metal.
At the same time, there is a weakness effect on the U.S. dollar, as lower bond yields reduce demand for dollars used to purchase Treasuries. This has been reflected in the DXY Index, which has recently fallen below the 100-point mark, signaling sustained weakness in the U.S. dollar against other currencies. As the dollar weakens, gold becomes cheaper for international buyers, improving accessibility and stimulating global demand. This dynamic has been a key factor behind the persistent buying pressure observed in recent sessions.
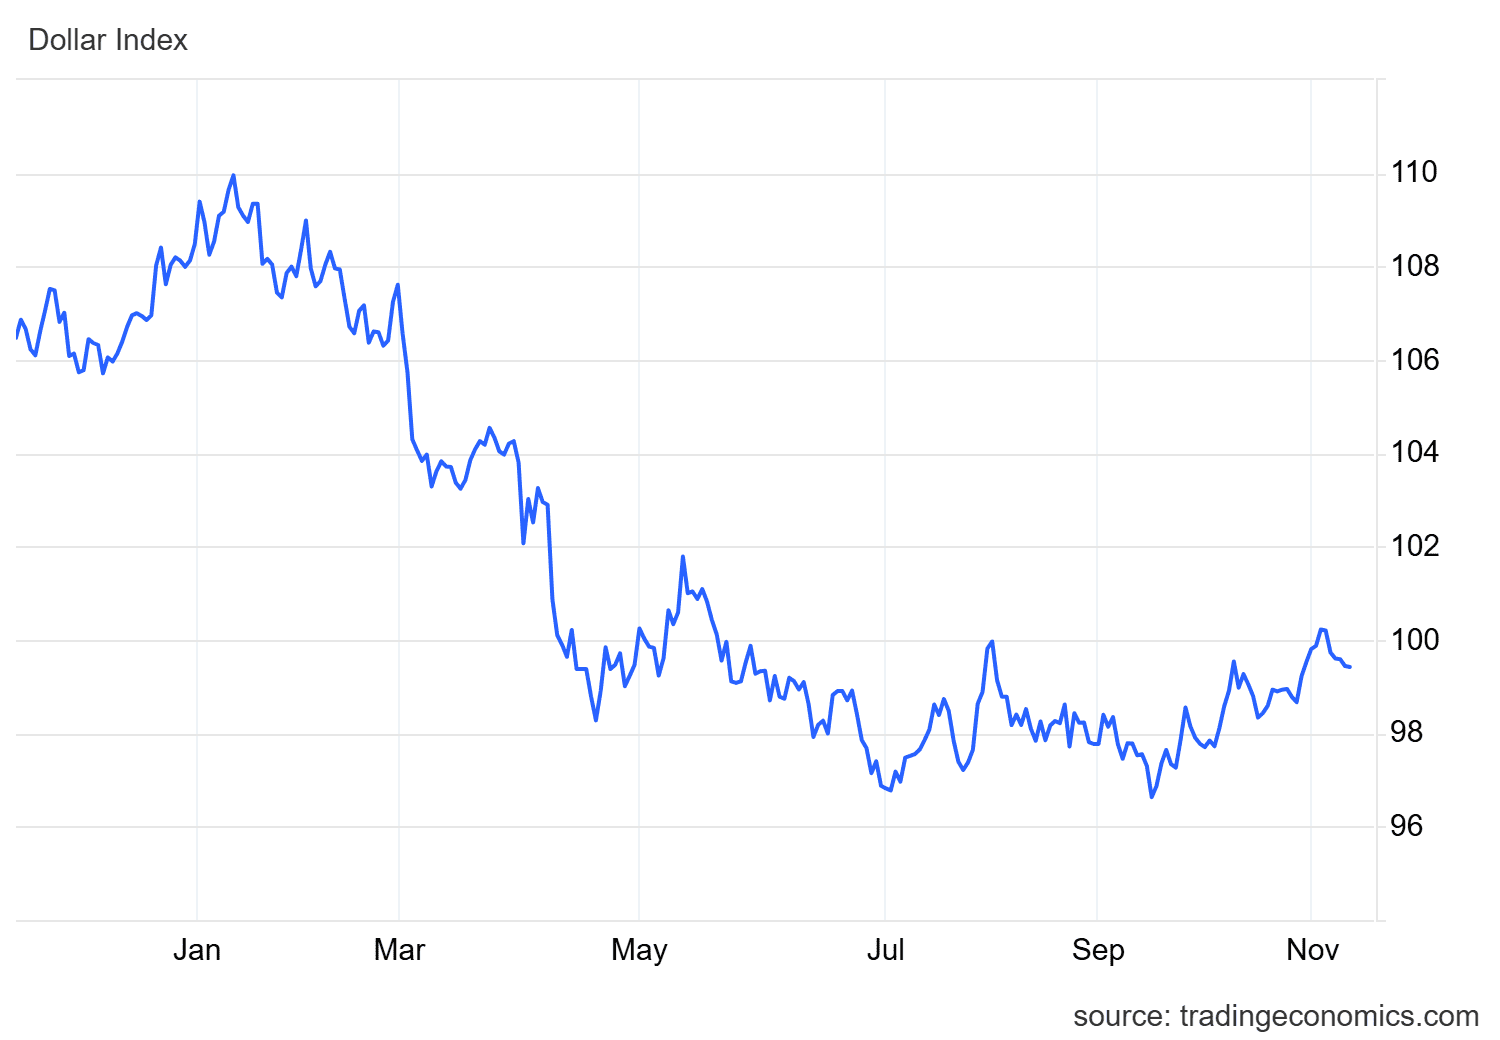
Source: TradingEconomics
Consequently, the combination of lower interest rate expectations, a weaker U.S. dollar, and declining bond yields has significantly strengthened gold, positioning it as one of the strongest-performing safe-haven assets of the year. If this trend continues in the lead-up to the Fed’s next meeting, the buying momentum behind gold is likely to remain highly relevant in the short term.
Technical Outlook for Gold
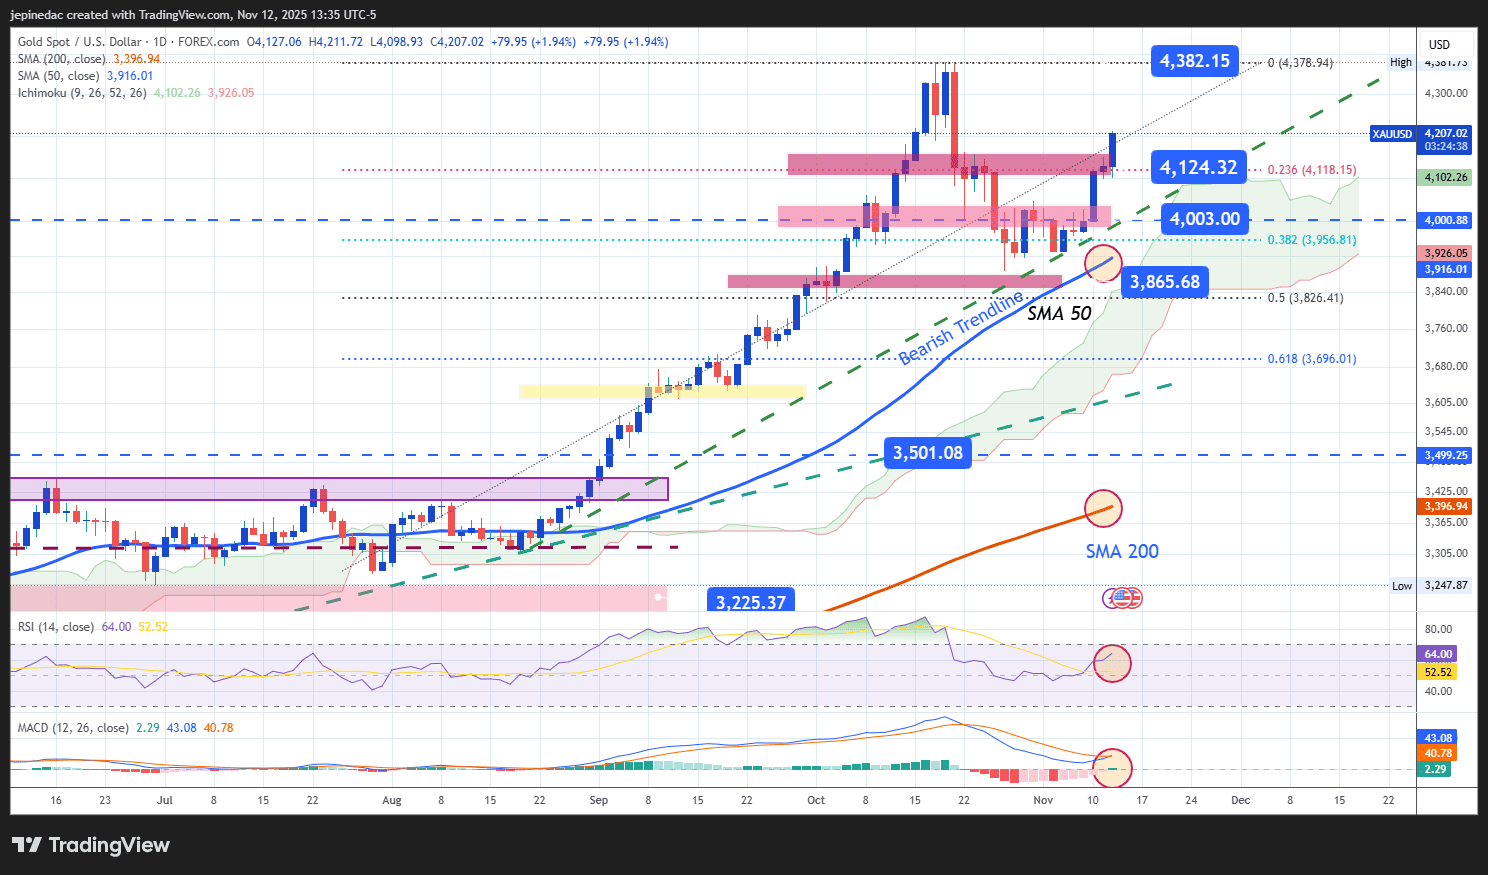
Source: StoneX, Tradingview
- Short-Term Uptrend Strengthens: Since late August, gold has established a new upward trendline that continues to support buying momentum and confirm a consistent bullish bias on the chart. Although the metal experienced moderate pullbacks in prior weeks, these were not significant enough to alter the prevailing bullish structure. As a result, the adjusted ascending trendline remains the key technical reference in the short term. If the price maintains its buying pressure, it could approach the all-time highs near $4,400 per ounce.
- RSI: The RSI indicator remains above the neutral 50 level, suggesting that bullish momentum continues to dominate the 14-session average, reinforcing the strong short-term uptrend. However, if the RSI quickly approaches the overbought zone near 70, it could signal a potential price imbalance, opening the door for temporary corrective pullbacks near key resistance areas such as the historical highs.
- MACD: The MACD histogram remains positive, with bars oscillating above the zero line and a bullish crossover forming between the signal line and the MACD line. This configuration supports the potential for sustained buying pressure, provided the indicator maintains its current pattern.
Key Levels to Watch:
- $4,382 – Major Resistance: Represents the all-time high zone and the most important bullish barrier in the short term. A breakout above this level could open the door to new record highs, reinforcing the dominant uptrend.
- $4,124 – Nearby Support: Intermediate support level corresponding to the 23.6% Fibonacci retracement. This area could serve as a technical support zone during potential short-term pullbacks.
- $4,000 – Critical Support: Considered the most important psychological level, this support coincides with the 38.2% Fibonacci retracement. A break below this level could put the current uptrend at risk and trigger a stronger bearish bias in the coming sessions.
Written by Julian Pineda, CFA, CMT – Market Analyst
Follow him on: @julianpineda25