
Gold has started the week with a clear bullish bias, posting gains of more than 1.5%, which has pushed prices toward new all-time highs near the $4,700 per troy ounce area. In the short term, demand is showing renewed strength, driven by rising geopolitical uncertainty following recent comments from the U.S. government regarding a potential reactivation of tariffs on Europe, amid disagreements related to the future of Greenland. This backdrop has once again increased risk perception across markets, supporting gold’s appeal as a safe-haven asset, a scenario that could continue to sustain buying pressure in XAU/USD over the coming sessions.

Trade tensions intensify
Since January 17, President Donald Trump has announced the potential imposition of 10% tariffs on products imported from eight European countries, with the measure set to take effect on February 1. According to the president, the decision stems from opposition by several European nations to his intention to purchase or exert control over Greenland, a territory he considers strategically important for the United States from a geopolitical and geostrategic standpoint. It was also warned that these tariffs could increase to 25% starting in June if no agreement is reached with the European bloc.
Europe’s response was immediate, rejecting the threats and labeling the tariffs as unacceptable, while reiterating that Greenland is not for sale. In addition, officials warned that these measures could lead not only to commercial retaliation, but also to a deterioration in diplomatic relations between two regions that maintain close trade and military ties. So far, no meaningful progress has been reported toward de-escalating the conflict, and Europe has called for an extraordinary meeting, which has begun to translate into rising indecision in market confidence.
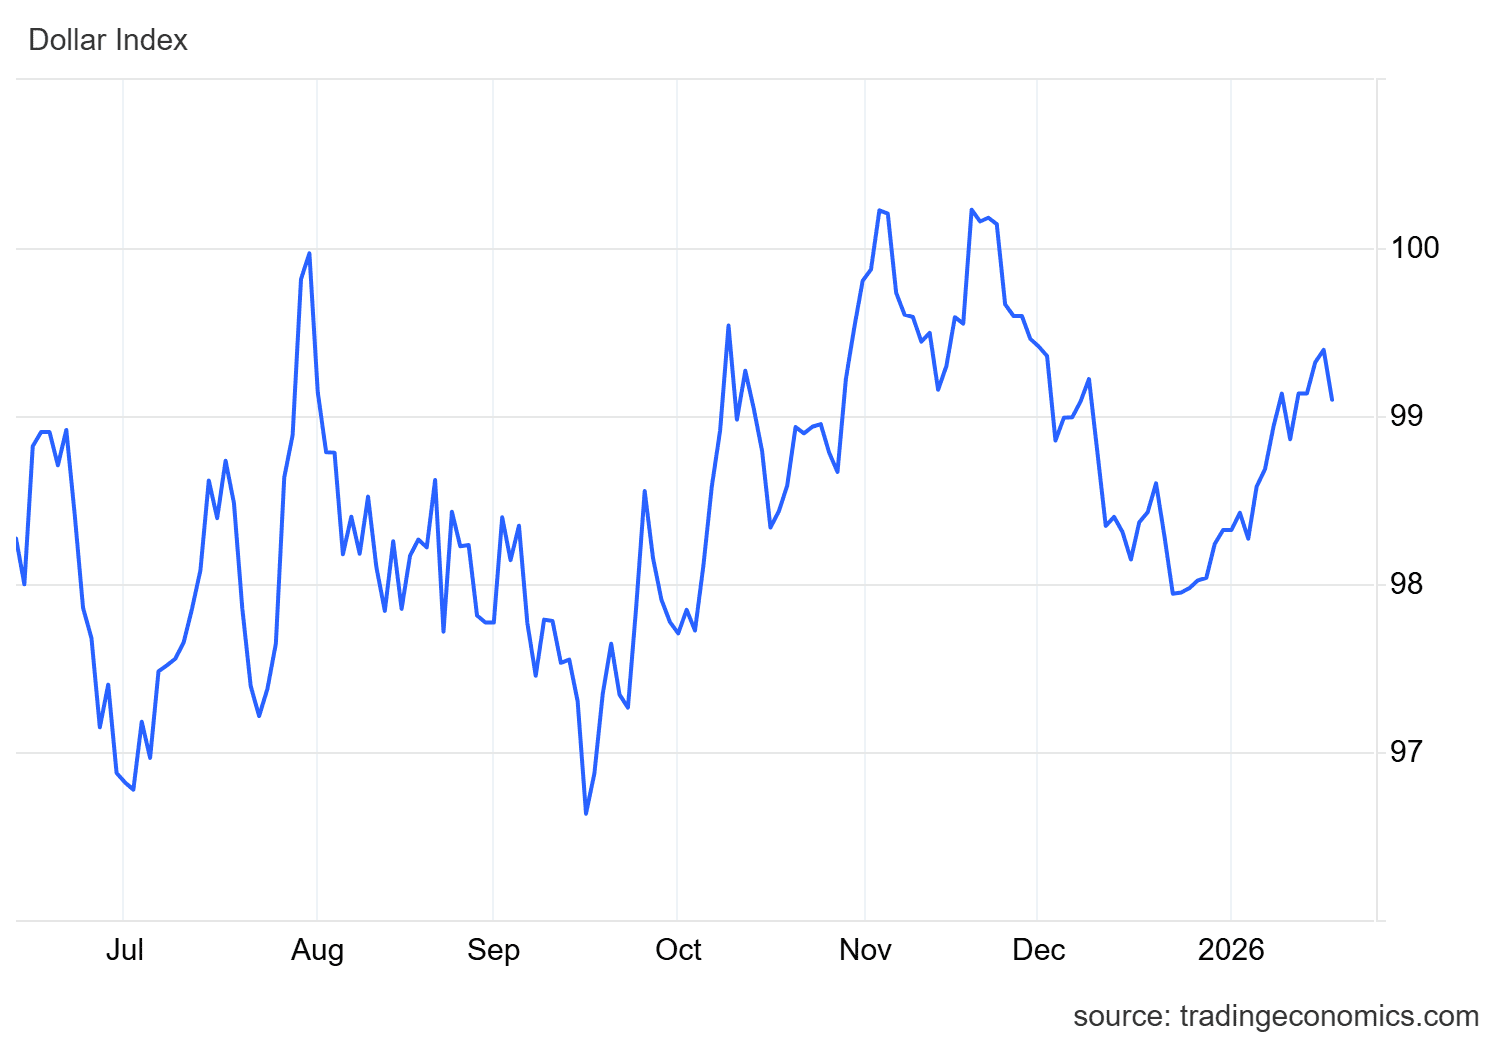
This environment has fueled uncertainty, as markets assess that a strong European response could negatively impact U.S. export performance, putting pressure on the dollar in the short term. In fact, this shift is already visible in the DXY index, which measures the dollar’s strength against its major peers and has declined from 99.4 points toward the 99.10 area, signaling renewed weakness in the U.S. currency.
Source: TradingEconomics
Against this backdrop, the escalation of diplomatic and trade tensions appears to be weighing on the dollar, while gold begins to absorb part of the capital flows exiting the currency market. As long as geopolitical risk remains elevated and the dollar maintains a fragile tone, the precious metal could continue to act as a hedging asset, benefiting from a temporary loss of confidence in the U.S. dollar while the direction of trade negotiations becomes clearer.
Is market confidence at risk again?
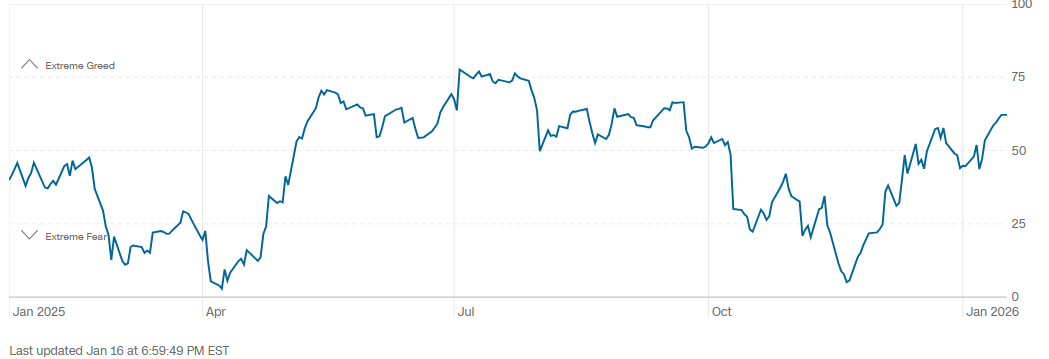
Gold typically benefits during periods of deteriorating market confidence, and this dynamic is starting to emerge in key indicators. CNN’s Fear and Greed Index currently stands near 62 points, still within the “greed” zone, although the curve has begun to show a notable flattening, suggesting that indecision is regaining ground in the short term.
Source: CNN
If this gradual erosion in confidence solidifies over the coming sessions, markets could shift toward a more risk-averse environment, favoring increased demand for safe-haven assets. In that scenario, gold could gain relevance as a capital preservation instrument, potentially maintaining sustained buying pressure in the near term.
Technical Outlook for Gold

Source: StoneX, Tradingview
- Dominant bullish trend: For several months now, gold has maintained a solid bullish structure, defined by higher highs and higher lows that have consistently pushed prices into new record territory. At this stage, there are no clear technical signals suggesting a trend reversal, although proximity to key psychological levels could lead to consolidation phases or technical pullbacks before the uptrend resumes.
- RSI: The RSI remains in overbought territory, around the 70 level. At the same time, a bearish divergence has formed, as prices register higher highs while the indicator prints lower highs. This pattern suggests potential short-term exhaustion in buying momentum and opens the door to technical corrections.
- MACD: The MACD histogram is oscillating near the zero line, reflecting a temporary balance between buyers and sellers. This behavior often precedes consolidation phases or corrective moves before the market defines its next directional impulse.
Key levels to watch:
- 4,700 USD – Crucial resistance: This level represents the market’s primary psychological barrier, particularly given the lack of historical references above it. Sustained price action above this zone could reinforce the bullish bias and open the door to a search for new highs in the short term.
- 4,538 USD – Nearby barrier: An area that corresponds to a former all-time high, now acting as a relevant technical reference. In the event of a pullback, this level could serve as short-term support, helping assess whether the bullish structure remains intact.
- 4,333 USD – Critical support: A technical level aligned with the 50-period simple moving average. A decline toward this area would test the current bullish structure, and a sustained break could open room for a more relevant bearish bias in the sessions ahead.
Written by Julian Pineda, CFA, CMT – Market Analyst
Follow him on: @julianpineda25