
Gold and silver prices are breaking down below the key psychological marks of 5000 and 80, hinting toward a steeper fall as crude oil prices stick near the $100 mark, while this week’s central bank expectations lean hawkish and cautious, entering the third week of the Middle East conflict.
The confusion over the precious metals’ lack of a haven rally in line with the dollar is evident in the markets, with the possibility of their drawdown against the dollar’s haven and inflation-risk strength linked to:
- Profit taking and a steep momentum recharge following an extended surge between 2025 and 2026
- Rising yields as a result of inflation risks and hawkish central bank expectations
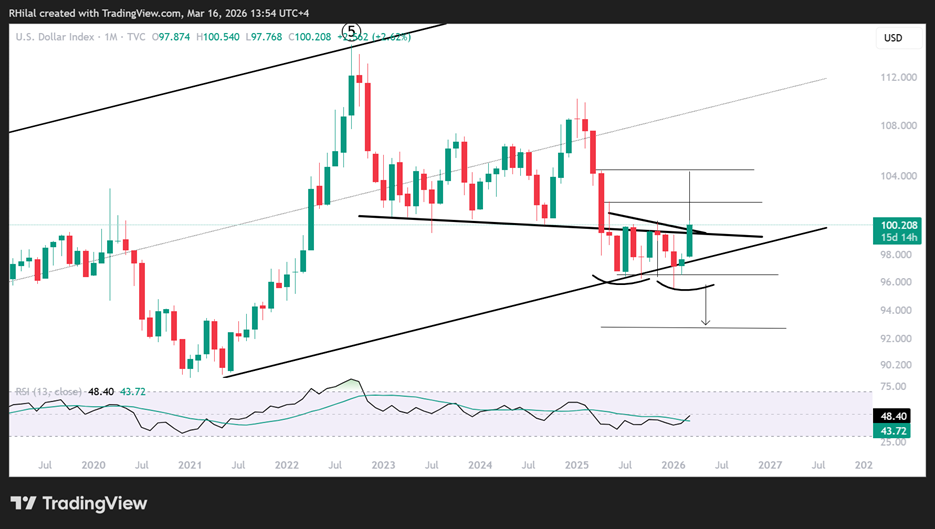
- A bullish breakout setup on the US Dollar Index, a move that can push gold and silver into steeper drawdowns, potentially opening the way for dip-buying opportunities in alignment with the broader primary uptrend.
DXY Outlook – Monthly Time Frame – Log Scale
Source: Trading view
Key Events to Watch
- Strait of Hormuz extended closure or potential reopening in line with Trump’s call for allies to help reopen the strait
- Central bank meeting tones and outlooks amid crude’s stickiness near $100
Key Levels to Watch
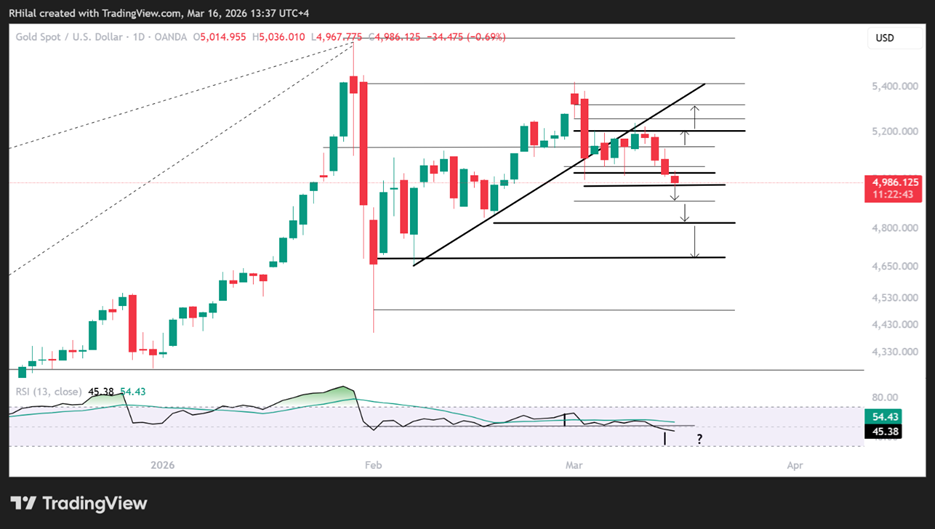
- Gold: upside 5150 – 5250, downside 4960
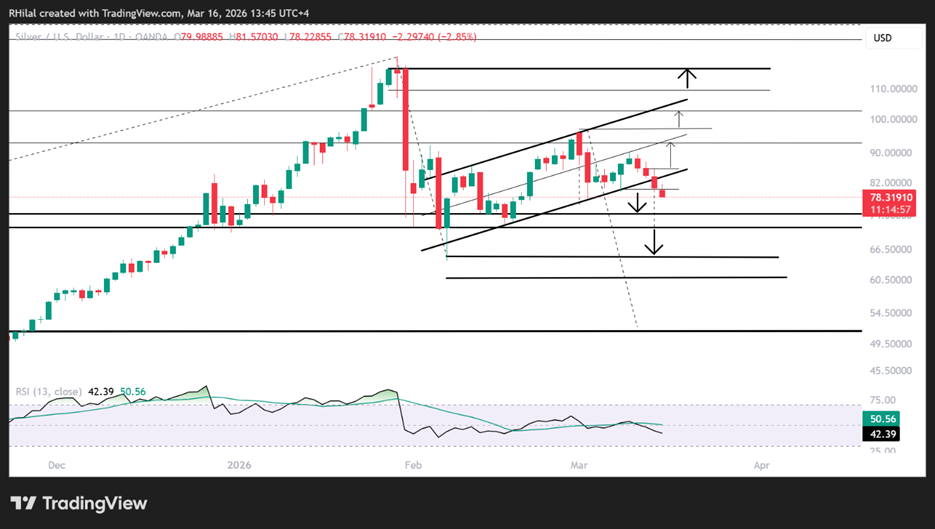
- Silver: upside 85 – 90, downside 75 – 65
Gold Price Outlook: Daily Time Frame – Log Scale
Source: Trading view
In line with my previous Gold &Silver Video, including the dollar’s bullish hold and consolidation near 100.50, gold remains in consolidation below 5200, trading beyond the trendline connecting higher lows since February 2026. The bias leans bearish below the 5000 threshold, with the 4960 support acting as confirmation for steeper drops.
Bullish Scenario: A weekly close above 5150 – 5250 exposes: 5320 – 5400 – 5600 – 6000.
On the downside, a close below 4960 exposes a deeper correction toward: 4840 – 4680 – 4480.
These represent approximately 200-point declines between previously respected support zones. A decisive break below the February 2026 lows could trigger an extended correction of approximately 1,000 points, potentially resetting momentum before gold realigns with longer-term bullish prospects and new record highs.
Silver Price Outlook: Daily Time Frame – Log Scale
Source: Trading view
In terms of silver, a more alarming bearish setup can be seen with:
- A possible head and shoulders continuation pattern in Feb–March promoting downside to the 65 mark
- A possible bearish flag pattern in Feb–March promoting downside to the 50 mark
- RSI taking the shape of a head and shoulders continuation pattern near the 50 neutral zone, dipping below the 50 neutral barrier
With this setup in place, and price action below the bounds of that channel, a close below 75 extends drawdown risks to 70, 65, 60, and 50 respectively. On the upside, closing back within the channel bounds and above 85 revives upside risks toward 90, 97, 100, and 117 respectively.
Written by Razan Hilal, CMT
Follow on X: @Rh_waves