
Caution remains elevated below 4,880 and 84 across gold and silver charts, leaving metals exposed to potential downside risks. As the saying goes, history does not repeat, but it often rhymes—especially when technical signals build toward a confirmation consensus while fundamentals remain cautiously driven by rising uncertainty around Hormuz.
Beyond the case for another drawdown or potential surge, price action is expected to lead through the headline noise—one key level at a time—within the broader long-term framework, while fundamentals tend to follow and explain moves afterward. Fundamental drivers may revolve around expectations for the next FOMC outlook and the duration of Hormuz closure.
I covered gold and silver charts in today’s webinar.
You can register for free via the following link: https://attendee.gotowebinar.com/register/4193734615457373531
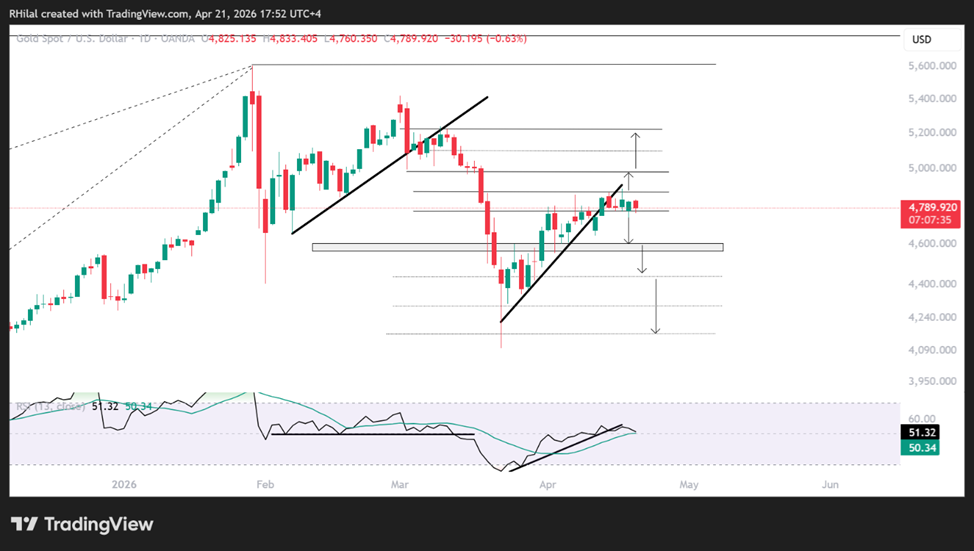
Gold Price Outlook: Daily Time Frame – Log Scale
Source: Trading view
On the daily chart, gold is forming a consolidation structure with higher lows from the 4,080 level and capped highs below the 4,880 resistance. This setup resembles the structure observed after the February rebound into the March 2026 highs, leaving two key scenarios in focus: a breakout above resistance or a breakdown below trendline support.
Bullish scenario
A close above 4,880 would open the path toward 4,980, where initial pullback risks may emerge. These levels align with the 0.618 and 0.786 Fibonacci retracement levels of the March 2026 decline.
A sustained move above 4,980 would reinforce the longer-term outlook toward 5,250, a key barrier before extending toward the 5,600–6,000 range or transitioning into another consolidation phase.
Bearish scenario
A close below consolidation support at 4,760 would extend short-term drawdown risks toward 4,660 and 4,480. Further downside could expose 4,300, 4,180, and 4,120 as potential support zones.
From a longer-term perspective, a confirmed break below 4,080 would increase the likelihood of a deeper move toward 3,900 and 3,500 as potential accumulation zones—potentially aligning with a broader correction in silver toward the $50 area.
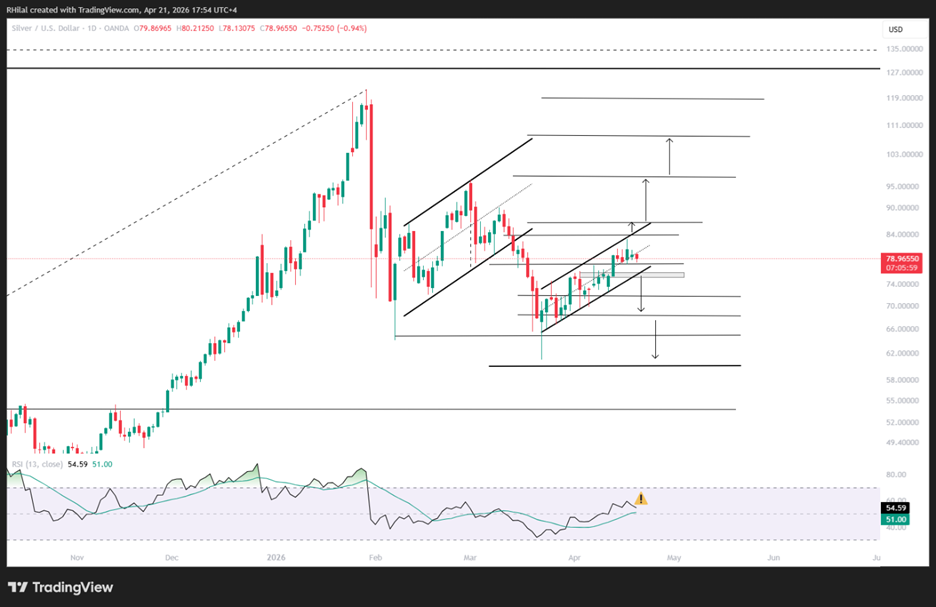
Silver Price Outlook: Daily Time Frame – Log Scale
Source: Trading view
On the daily chart, similar to gold’s March 2026 pattern, silver is also showing a rhyming structure. Price action continues to respect a bullish rebound within a parallel channel, raising the probability of a continuation flag formation.
Bullish scenario
A close above 84 would open the path toward 86 and 96, before potentially extending into a new record surge toward the 120 level, where pullback risks may re-emerge.
These levels align with the 0.382, 0.5, and 0.618 Fibonacci extension levels of the April 2025 – January 2026 – March 2026 trend.
A sustained move above 120 would reinforce the longer-term bullish outlook toward 200.
Bearish scenario
A break below 78 would extend short-term downside risks toward the rising trendline from the 61 low, with interim support levels at 76 and 75.50, where a short-term rebound may develop.
A deeper breakdown would increase the risk of an extended decline toward 68, 65, and 60. From there, silver could either stage another rebound or extend losses toward the 50 level—aligning with gold’s bearish scenario below 3,900 as a potential long-term distressed buying opportunity.
Long-term levels remain critical in distinguishing structural shifts from headline-driven volatility, particularly within the context of US–Iran negotiations and developments surrounding the Strait of Hormuz.
Written by Razan Hilal, CMT
Follow on X: @Rh_waves