Gold Rally Slammed as USD Breaks Out
Gold exhibited more consolidation characteristics today as a strong rally from the $4k psychological level was slammed following a run towards resistance around the 4150 area, going along with a strong rally in the US Dollar. Given that the two significant consolidation periods in the gold rally that started last February were two months and four months, the fact that we’re only one month into the current pullback suggests that bulls may not yet be ready to break out to fresh highs.

The support hit yesterday morning was a clean test of the $4,000 psychological level which, at the time, was confluent with a bullish trendline taken from the October and November swing lows. That led to a strong outing yesterday and that extended earlier this morning until the trend came pushing back-below the $4100 level.
From the hourly chart below, it looks like a failed breakout after a push above $4100 found support at prior resistance. But, from longer-terms, this resembles more of a consolidation pattern following a really massive up-trend, and that can lead to a continued bullish bias even though we may not necessarily be in a space where bullish breakouts are yet ready to take hold.
Gold Hourly Chart
Chart prepared by James Stanley; data derived from Tradingview
Gold Consolidation During the Rally
If we dial back to February of last year Gold was still working to gain acceptance above the $2,000/oz level. But as the Federal Reserve seemingly shrugged off strong inflation data and, instead, primed the market for rate cuts later in the year, Gold traders tried to get in front of the move by buying and that led to a massive ramp in 2024 trade.
That rally pushed all the way until about a week before the US Presidential Election, with gold prices topping just inside of the $2800 level for a run of almost 40% in a little more than eight months.
It’s what happened after that’s of note for our current purposes, and that’s a symmetrical triangle that took two months to build.
Normally a symmetrical triangle carries no directional bias as it’s both higher-lows and lower-highs. But – when taken with the prior trend and the fact that bulls that had driven that move didn’t use the digestion to take profits, a bullish bias could be allowed and the formation can then be considered a bull pennant formation.
In 2025, that rectified in a big way, with Gold jumping all the way up to $3500/oz. And, again, a symmetrical triangle developed as longs took profits while fresh longs used the pullback to open or add to positions, and that formed a second bull pennant, with this one taking four months to build.
The breakout from that hit around Jerome Powell’s speech at Jackson Hole, and as the head of the FOMC signaled his willingness to cut rates, once again, market participants jumped on the long side of Gold and pushed a massive breakout, all the way until last month’s high of $4380.
Now, it seems we have another consolidation pattern forming and while it’s still early, this could be the next bull pennant formation in Gold.
Gold Daily Price Chart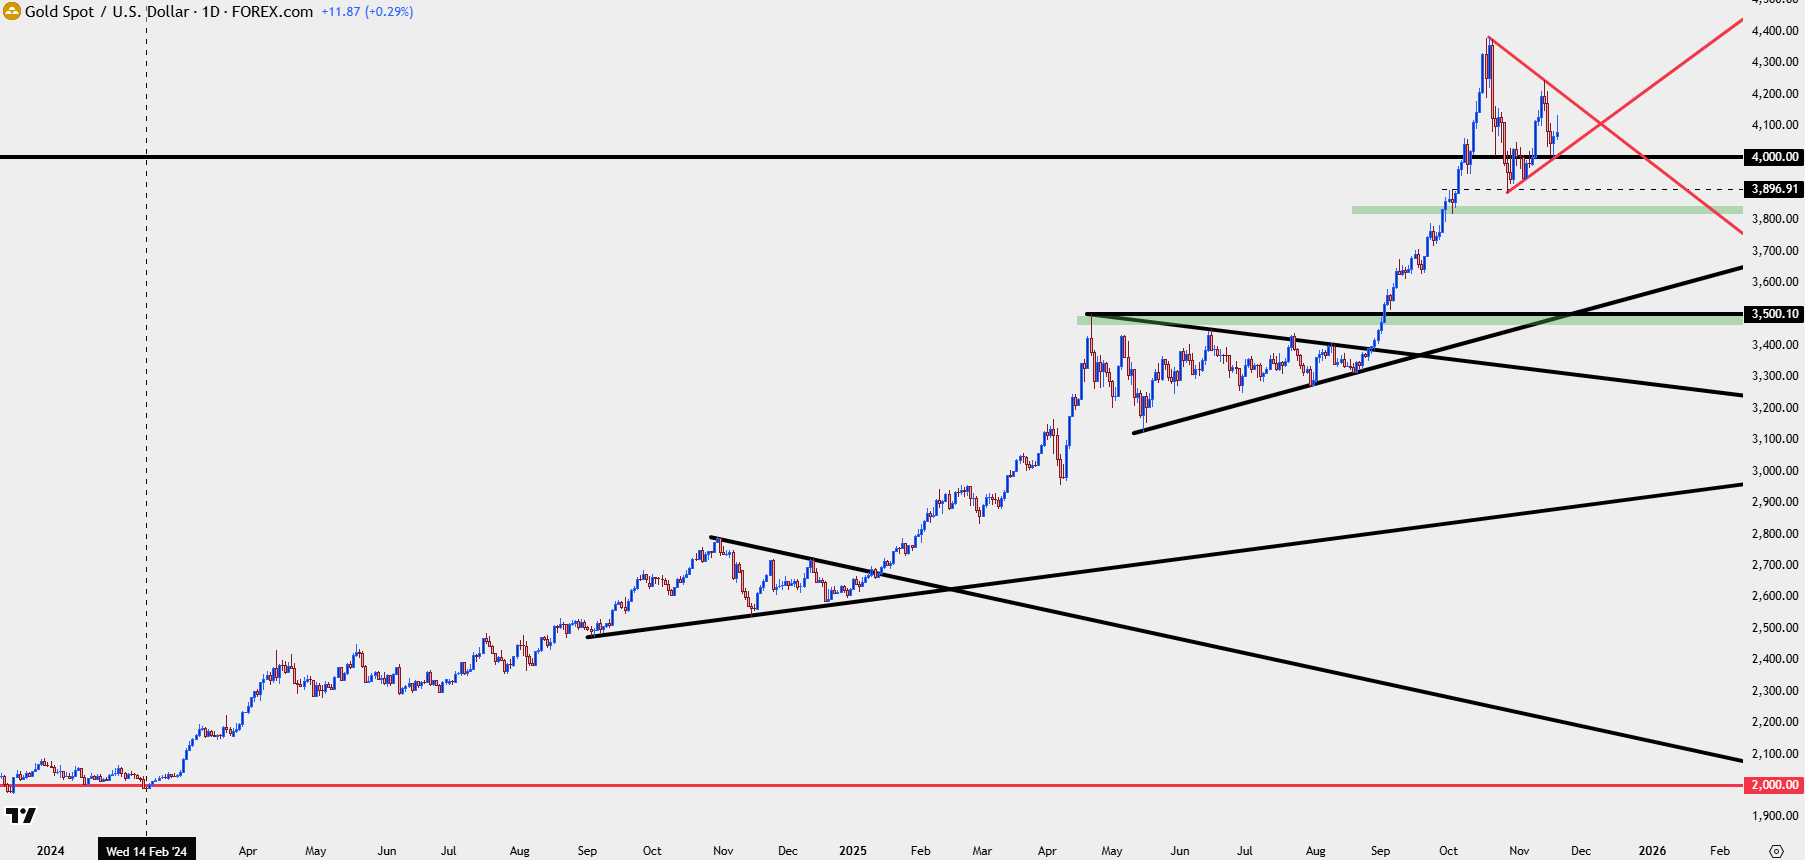
Chart prepared by James Stanley; data derived from Tradingview
How to Trade Consolidation with a Bias
If we look at each of those prior periods of consolidation, a link can be made to Fed policy and overarching macro conditions.
Last year, it was around the Presidential Election that markets started to get warm to the idea that the Fed may not be cutting rates much more after the 2024 close, as both inflation was high and the economy didn’t look to be in dire need of accommodation, especially given the rallies in equities.
And then earlier this year, matters were dark around the US economy in February and March and the wide expectation was that the Fed would have little choice but to cut; but it was around that same April inflection in gold that USD/JPY hit a significant low and began to rally and US equities came back to life in a very big way – both of which were driven by President Trump taking a step back on tariff implementation.
Gold then digested and drove into that consolidation pattern for four months, all the way until Powell finally signaled his readiness to ease rates.
So, we’re in another pattern where it seems that the Fed wants to display a degree of prudence, both from fear of an opaque economic backdrop given the lack of recent inflation data. But, does that mean that the Fed won’t cut rates again – or perhaps more pertinent, does that mean that we’re in a position where the Fed may actually hike rates?
I see this as more of a timing issue and as always, it’s difficult to predict trends. But – there is the possibility of approaching a consolidation pattern with a prior trend-side bias, meaning support structures can be attractive for bullish exposure while resistance tests are opportunities for targets and/or areas to be cautious of adding on exposure for fear of continued consolidation. And then when or if a breakout does hit, the approach can adapt back into more of a trend-based logic.
At this point, I’m tracking support in gold at $4044 and then the $4k level, both of which remain massive. If we get below $4k I want to approach more conservatively, and if we break the $3895 swing that came into play in late-October, that’s where we have to begin to consider larger sell-off backdrops.
Gold Four-Hour Chart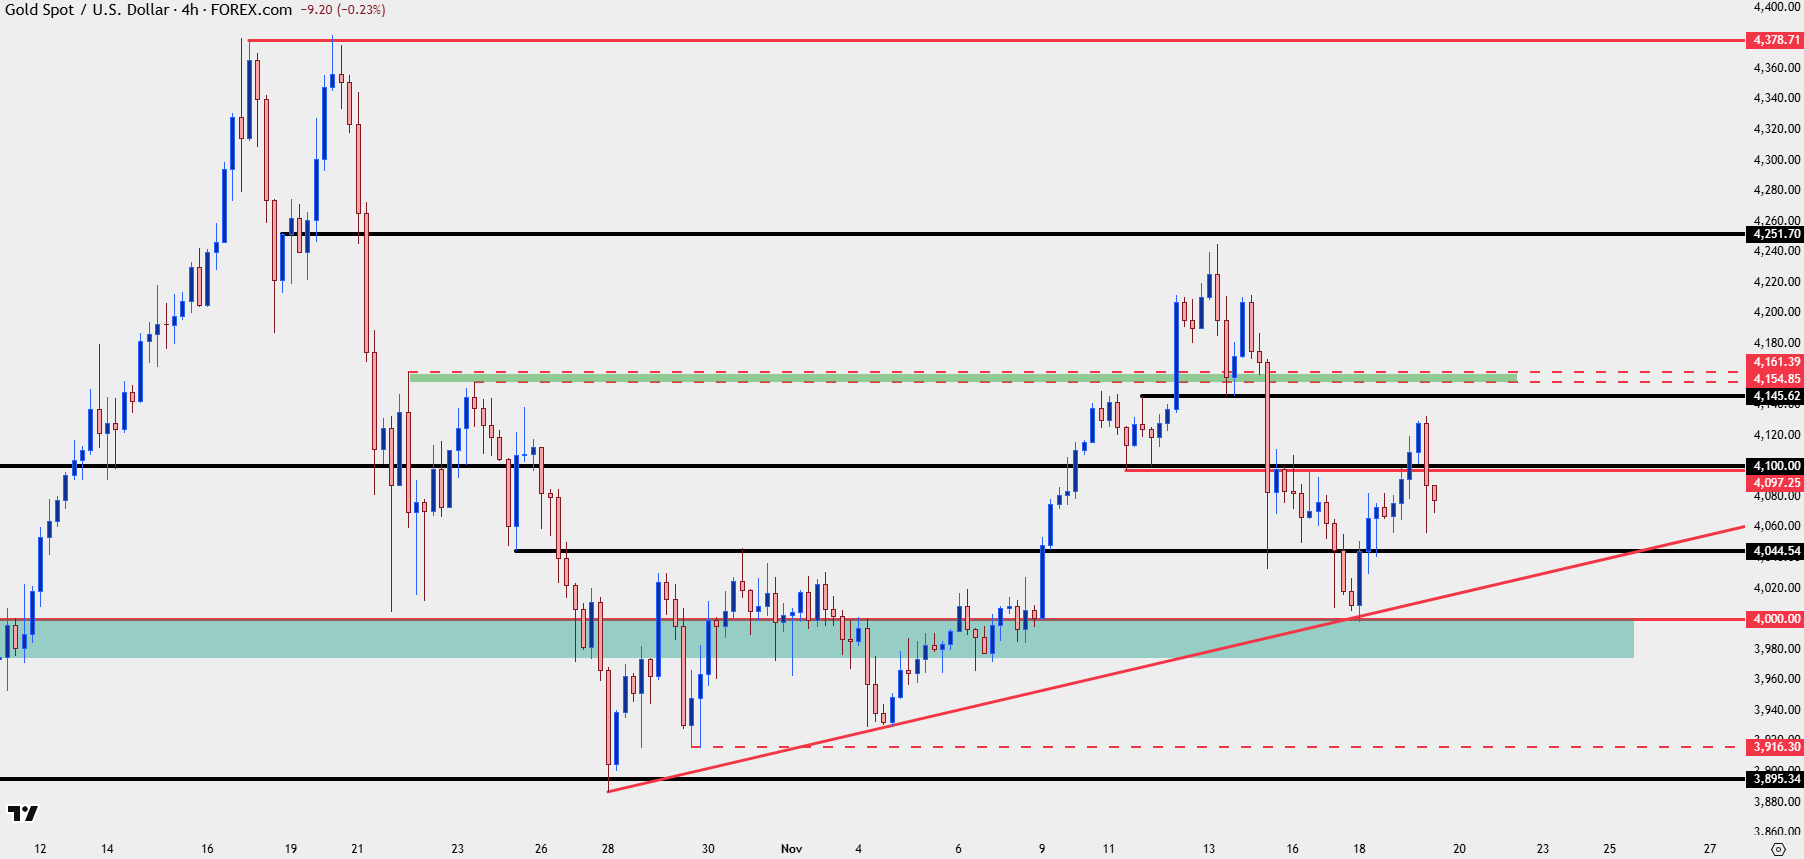
Chart prepared by James Stanley; data derived from Tradingview
--- written by James Stanley, Senior Market Analyst, Global Macro