



But – perhaps more encouraging to bulls is the growing sense of acceptance of the $5k level, which initially held as resistance after that pullback but for the past two weeks – has held as support. This gives buyers a bit of scope for a continued rally, but there’s a few levels of short-term interest that first need to be dealt with.
Gold Weekly Price Chart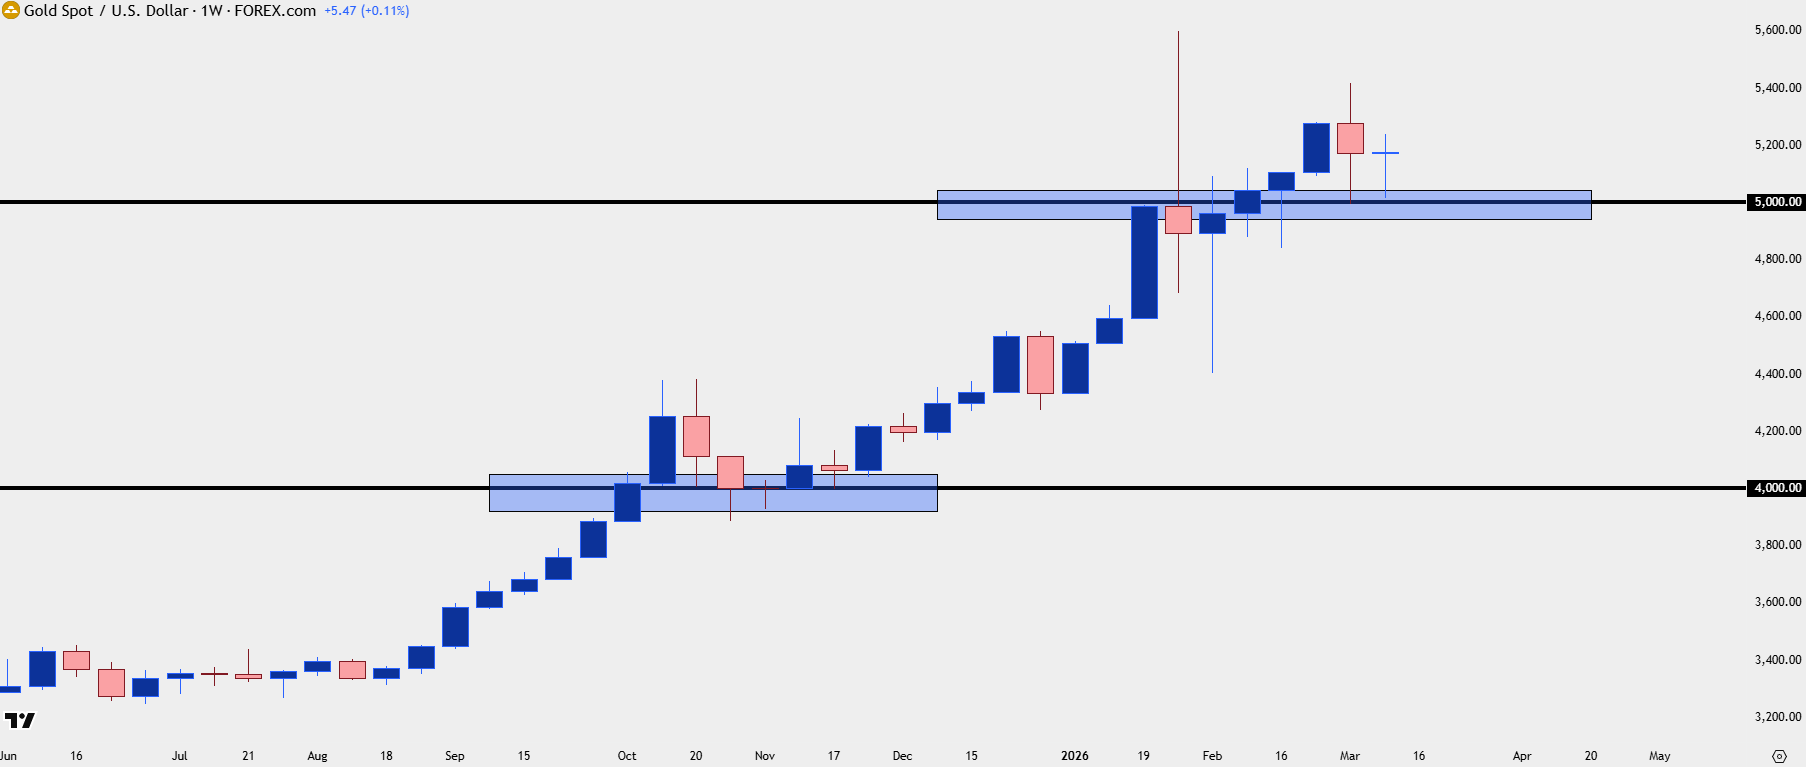
Chart prepared by James Stanley; data derived from Tradingview
From the daily chart in gold we can see where there’s been even more psychological levels at play, with the $5600 level marking the top back in January and then the $4400 level setting the low a few days later. Along the way, there’s been several other inflections such as last week’s high at $5400 and this week’s high, so far, at $5200.
While the daily bar may seem longer-term than what short-term traders are looking for, analysis of this nature can be useful, as an intra-day test of one of these prices can then open the door for short-term strategies going in that direction, similar to what we saw with the $5100 test on Monday of this week.
Gold Daily Chart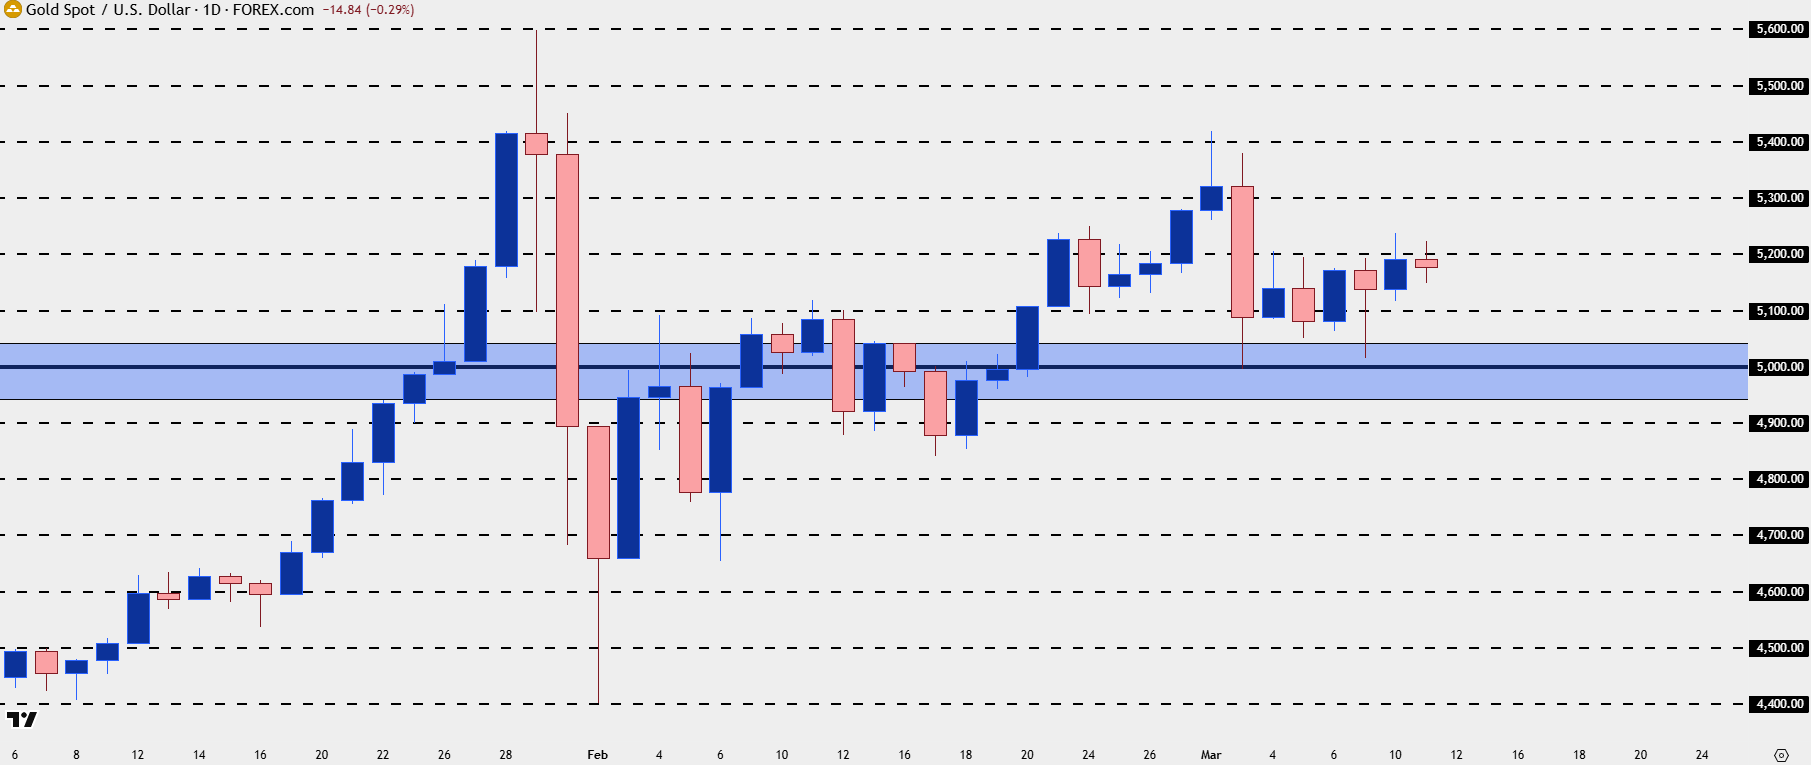
Chart prepared by James Stanley; data derived from Tradingview
Gold Shorter-Term
At this point, the short-term chart highlights well how buyers have come back to life since the late-January sell-off. Initially, it was the $5100 level that sellers defended and that built an ascending triangle formation. Those setups show higher-lows to go along with horizontal resistance and they’re often tracked with aim of bullish breakout, which is precisely what hit as price jumped up to the $5400 level.
But that’s where bulls got cautious again and that’s what allowed for last week’s pullback to the $5k level.
At this point, it’s the $5100 level of prior resistance that’s back in for support potential, as you can see from the four-hour chart below how $5200 has become the spot that bulls can’t leave behind.
Even if $5100 doesn’t hold, that doesn’t necessarily mean that bulls are done for as a hold of a higher-low – above the $5014 level – could keep bullish scope alive on the long side of gold.
Gold Four-Hour Price Chart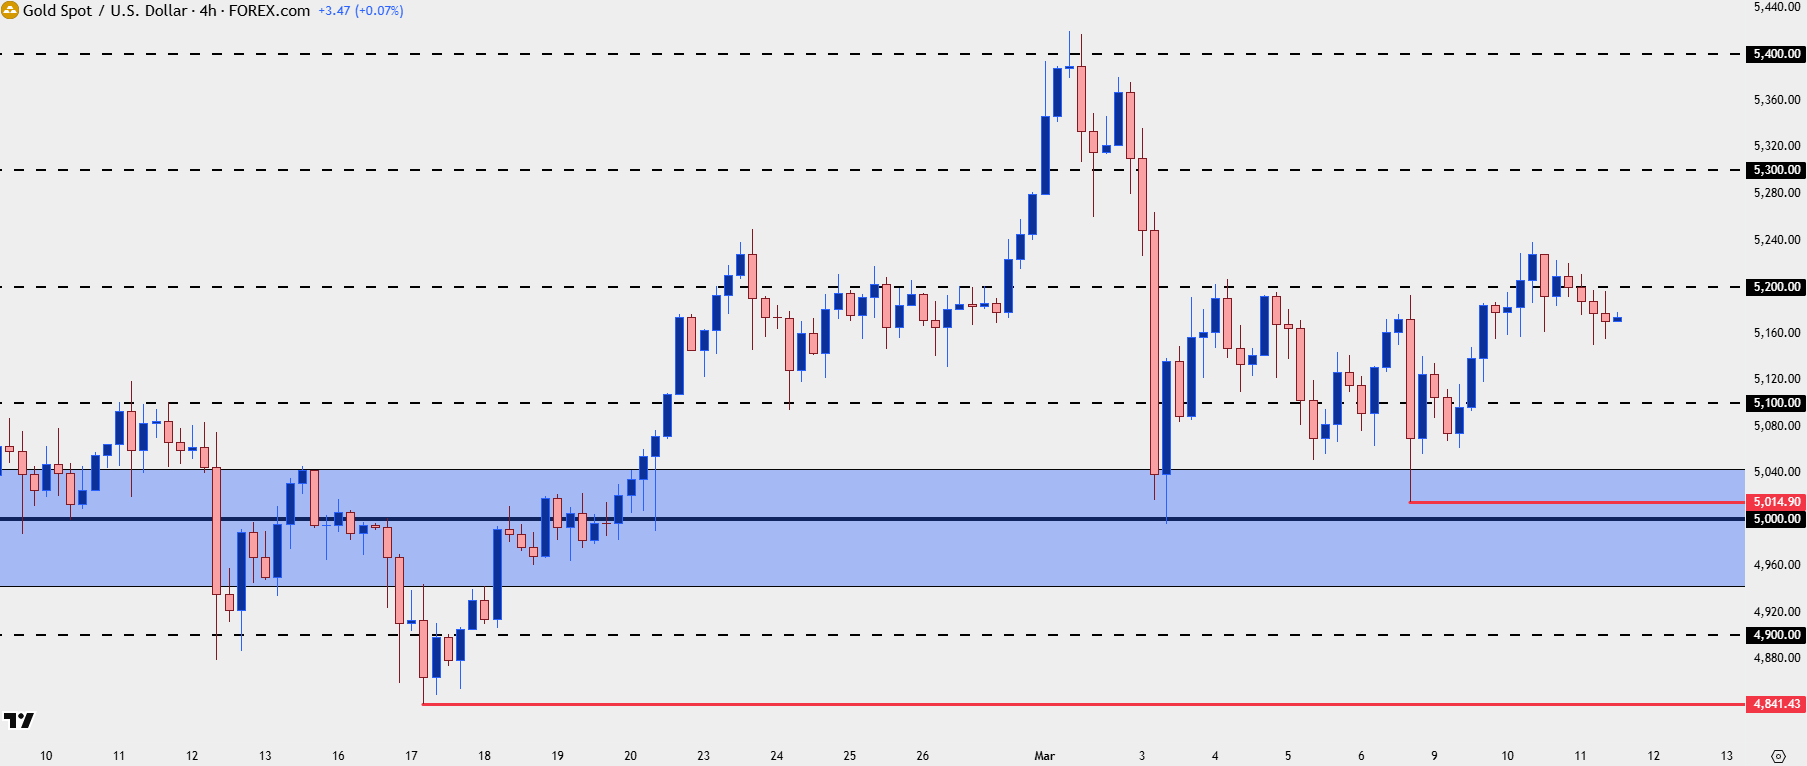
Chart prepared by James Stanley; data derived from Tradingview
--- written by James Stanley, Senior Market Analyst, Global Macro






