
Gold appears to have benefitted the most from renewed US dollar weakness and lingering trade uncertainty following the Supreme Court ruling on Trump’s tariffs on Friday. Investors worried that the news could put fresh stress on government finances, although stocks managed to bounce into the close. Still, that macro backdrop has kept gold outlook positive, with the metal wrapping up its third consecutive weekly gain on Friday.
Weekly gold chart looks bullish
Gold closed comfortably above the $5,000 mark on Friday. What really stands out to me is the bullish hammer-like candle on the weekly chart. That’s not the kind of structure you see in a market that’s ready to roll over. If anything, it tells me buyers are still in control of price action despite that big drop we saw at the end of January.
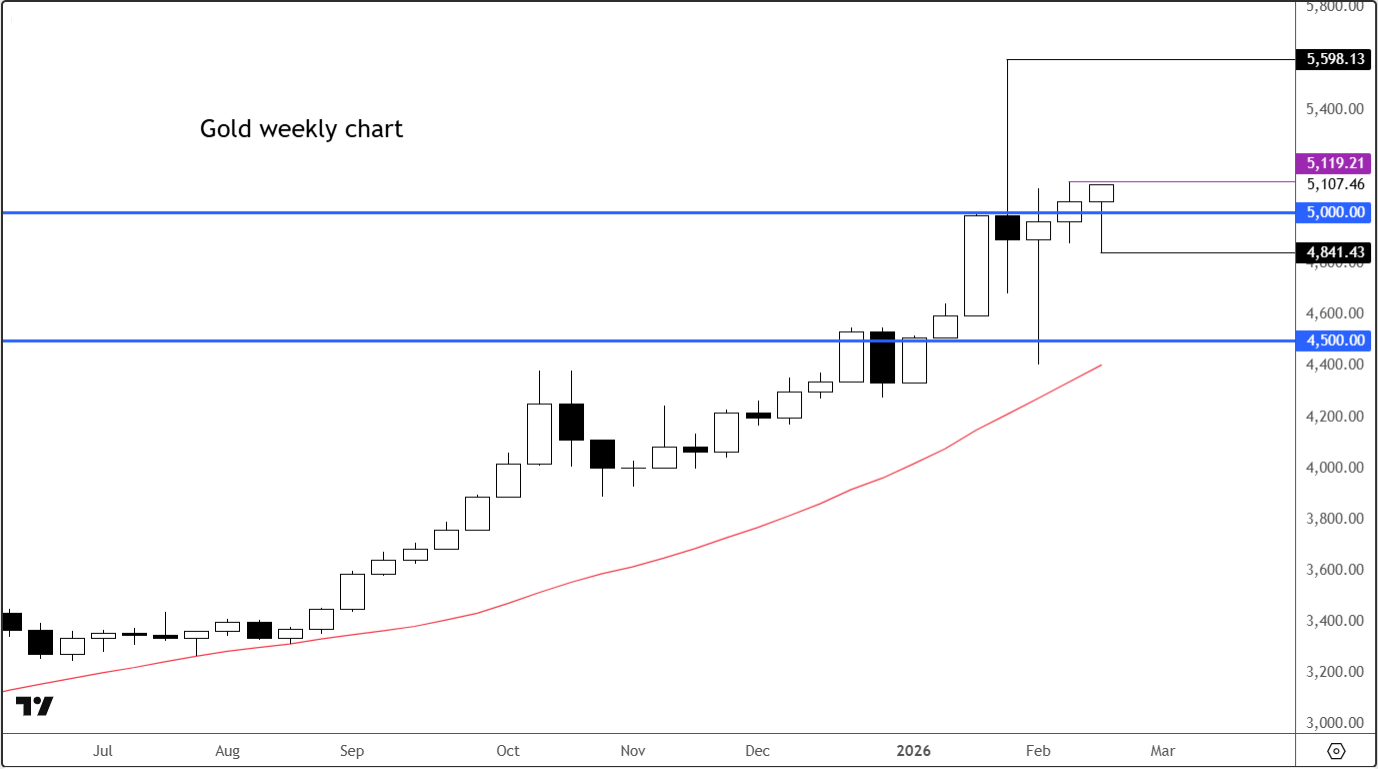
Right now, the path of least resistance looks higher. As long as price continues to hold above $5,000, I’m not interested in fading this move. The short side simply doesn’t make sense unless the charts start to deteriorate — and we’re not there yet.
Key XAU/USD short term levels to watch
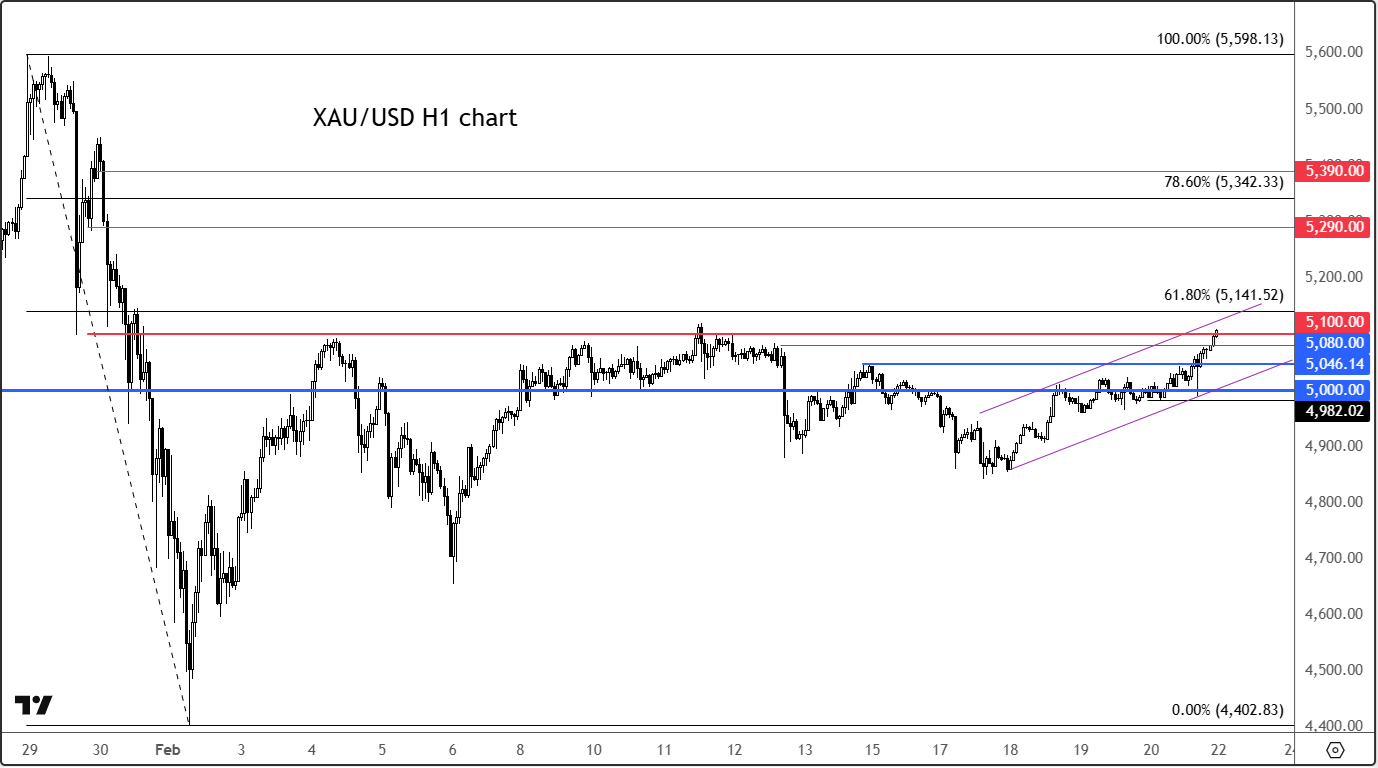
The breakout above $5,100 is also significant. That level capped price back on February 11th, and now we’ve closed a Friday session above it, which is constructive. When prior resistance levels give way and hold into the weekly close, it often signals that momentum is building rather than fading.
From here, the next upside level I’m watching is $5,290 — a former intraday support zone that collapsed during the sharp sell-off at the end of January.
Beyond that, $5,390 comes into focus. That’s another technically interesting area and one that could act as the next major upside magnet if momentum continues.
Meanwhile, it is also worth keeping an eye on the Fibonacci retracement levels from the late-January drop, which also line up nicely with the above levels. The 61.8% retracement sits around $5,141, while the 78.6% level comes in near $5,342.
Downside scenario for gold outlook
Now, let’s talk risk.
The $5,000 level is absolutely critical. It’s psychological, it’s technical, and it’s now the pivot that defines the short-term trend. If we slip back below it, the tone changes quickly. Even more important is Friday’s low at $4,982. That’s my line in the sand. A clean break below that level would likely trigger a deeper pullback and potentially unwind this latest leg higher.
Before we even get there, though, there are a few near-term supports to watch. The $5,046 area — prior resistance — could now flip into support. There’s also support around $5,080, which has attracted buying interest on a shorter-term basis.

In summary
For now, the structure remains constructive for the gold outlook in as far as the near term is concerned. Unless price action proves otherwise, dip buying look the trade that still pays, and momentum still favours the upside heading into the week ahead.
Source for all charts used in this article: TradingView.com
-- Written by Fawad Razaqzada, Market Analyst
Follow Fawad on Twitter @Trader_F_R