Gold Talking Points:
- The fundamental backdrop favors gold as the US Treasury Secretary has continued to talk up ways of keeping yields low without mentioning the prospect of cutting spending or raising taxes.
- Fundamentals aren’t a perfect push point for price as only actual buying and selling drives market movements, and the question now is whether the long side is top heavy on a short-term basis with daily RSI showing overbought readings.
- This doesn’t necessarily spell reversal but it could highlight possible pullbacks, which could be monitored for bullish trend continuation purposes.

Gold prices are currently up close to 14% in the month of August and that’s the strongest month for spot XAU/USD in at least 17 years, with a bit of time left to go. And more attractive than just the rally is how the move happened, with six months of digestion from the prior parabolic rally followed by a build of support at the $4k level.
This illustrates the possibility of central bank reserves pushing into gold and away from other markets. China, for example, holds more than half a trillion less in US Treasuries than they did in 2015, when Donald Trump began talking up trade wars ahead of his first term in office. And this isn’t resultant of a Chinese economy contracting as much as diversifying away reserves into other markets, such as gold.
So when we saw repeated tests and failure from sellers to push through a downside break at $4k the first thing that comes to mind is a big market player (or several of them) jumping in to buy at a ‘perceived value.’
Gold Weekly Chart: $4k Defense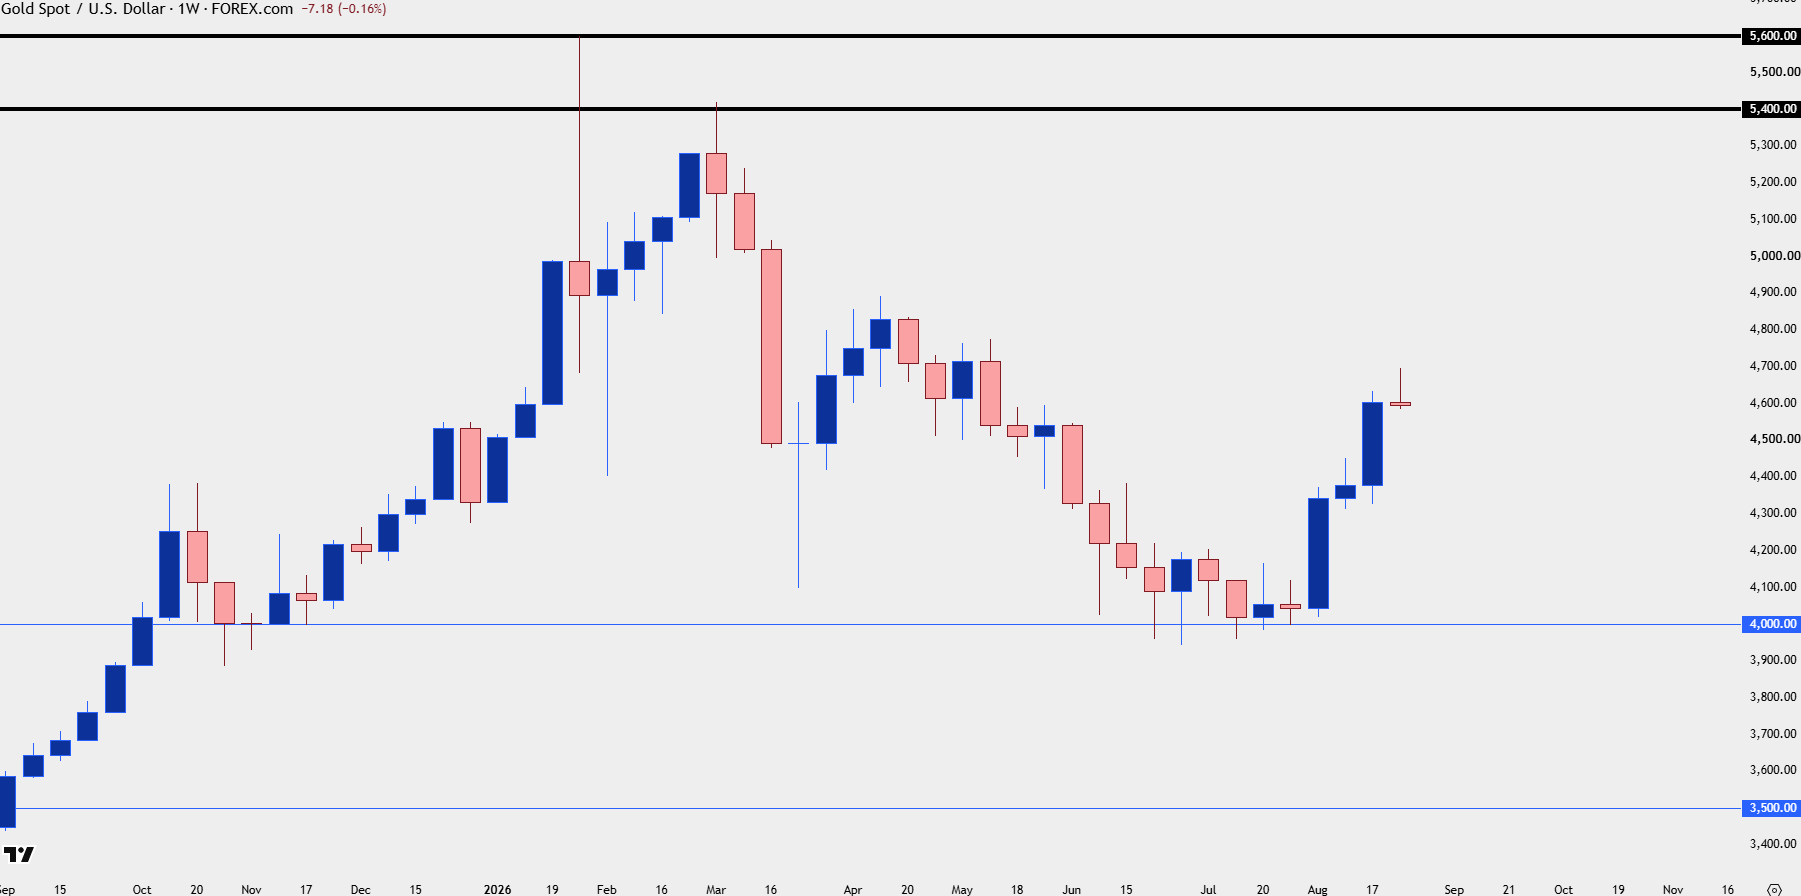
Chart prepared by James Stanley; data derived from Tradingview
This wouldn’t necessarily spell a direct bullish reversal, however, as this would merely set a floor of sorts that would grind through sellers looking to pare positions. What would be needed to fire that reversal is a return of demand at fresh short-term highs, and then a show from buyers on initial pullbacks to establish higher-lows and that’s what’s arrived in the month of August.
In late-July, as Kevin Warsh and the Fed avoided rate hikes despite a coin flip probability of getting one, followed by a dual intervention in the Japanese Yen, the fundamental backdrop was warming for such a scenario and I even tweeted this at the time.
Gold: The Fundamental Backdrop Leading into August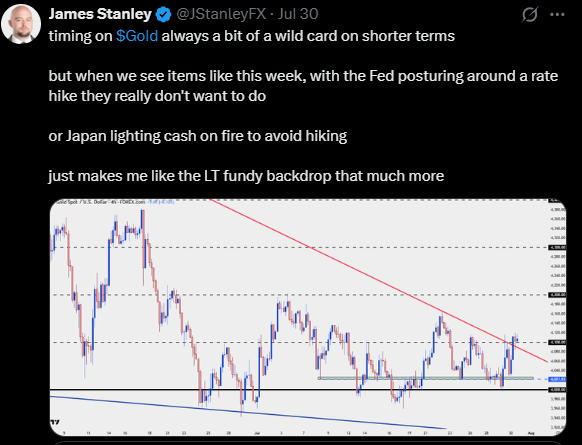
Taken from @JStanleyFX on X.com
Gold Techs
As alluded to in the message above shorter-term dynamics will often derive influence from quirks related to small sample sizing, longer-term looks at a market can help to highlight the underpinnings of what may drive that next move, and this is what I had highlighted as we came into August with gold setting up multiple support tests at the $4k handle.
As that support was in play, gold built a falling wedge which is a formation often approached with aim of bullish reversal, and that broke out in a big way the week after the FOMC rate decision, with another shot-in-the-arm at the US Treasury buyback announcement.
Gold Daily Chart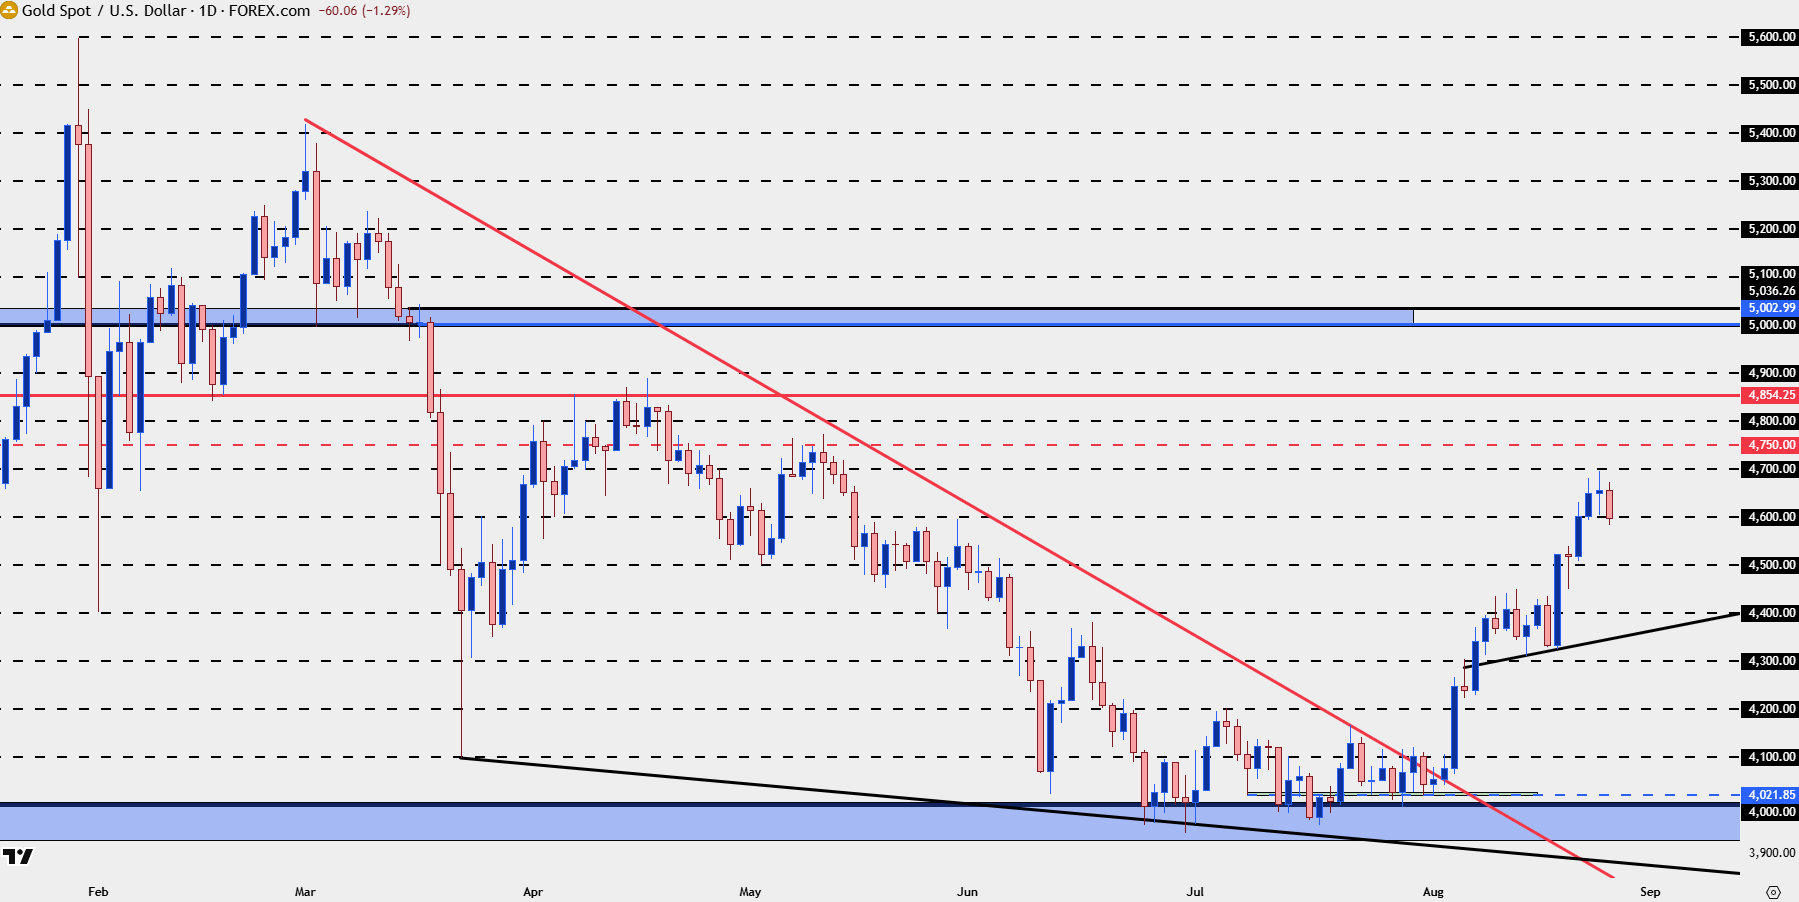
Chart prepared by James Stanley; data derived from Tradingview
Gold Strategy
At this point the trend is bullish on longer-term charts and the challenge remains one of dealing with an overbought market, with daily RSI currently showing a push back-below the 70 level (although that can change based on today’s daily close).
That’s normally construed as a bearish indication although RSI is notoriously ‘untimely’ when dealing with prolonged trend situations, particularly when there’s a new trend taking over that can push the indicator into overbought or oversold conditions for weeks or months at a time. This is what happened in September and October of last year, then again in December, and then in January of this year, so I wouldn’t want to read too much into that dynamic although it can be helpful in highlighting the danger of chasing.
Instead, a pullback can open the door for bullish continuation scenarios and we already have the nearest spot of interest for that in-play right now with $4600. A bit deeper, a prior zone of resistance from the $4524 level down to the psychological level of $4500 stands out, and that’s followed by the prior swings at $4435-$4450.
With such scenarios you can’t expect perfection nor can you expect to call the ‘exact’ bottom, and this is where something like candlestick formations can come into play even on a shorter-term chart, such as the four-hour. A hammer formation or perhaps even a doji after a pullback, which could allude to a possible short-term morning star formation could be seen as bullish catalysts in the direction of the larger trend.
Gold Four-Hour Price Chart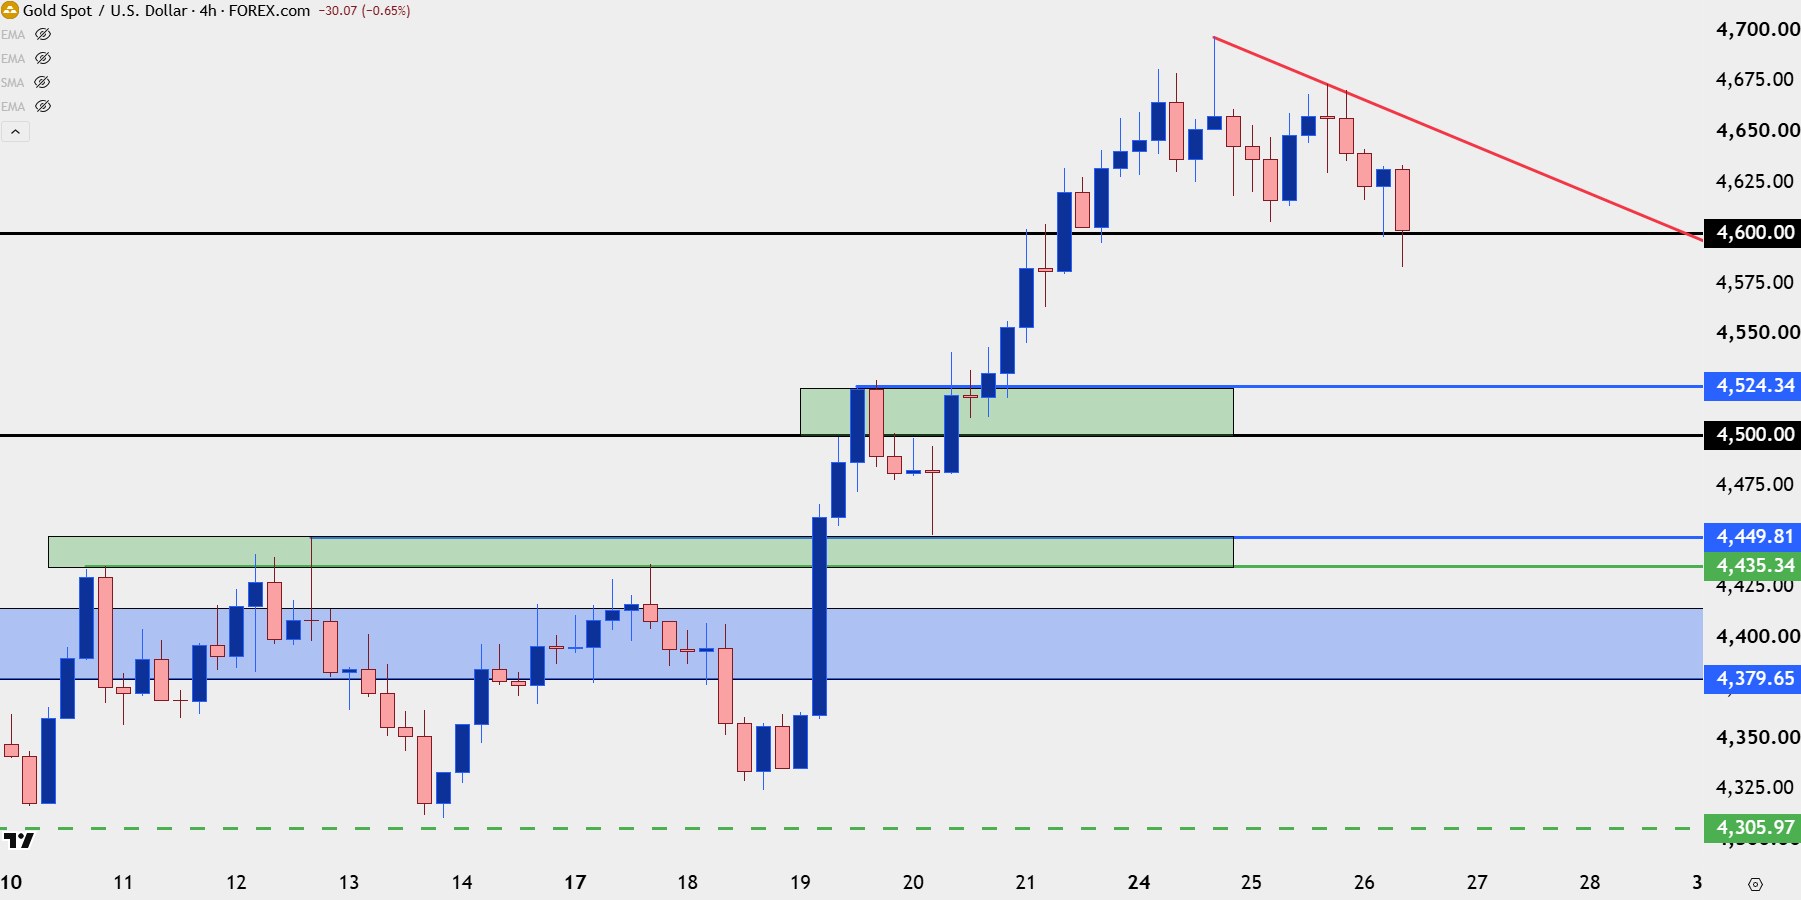
Chart prepared by James Stanley; data derived from Tradingview
--- written by James Stanley, Senior Market Analyst, Global Macro