



Gold has been in a strong bullish trend for more than two years now but so far, since the March open, that trend has been going in the other direction, with a hastening in the sell-off this morning as spot gold prices have given up the $5k level.
The move so far hasn’t been as stark as the late-January sell-off, which spanned three days but saw almost $1200 taken out of spot prices. But it was from that low in early-February just above the $4400 level that buyers started to dig out another bullish trend, eventually running up to $5400 at the start of this month.
Initially, a $5k re-test led to a bounce, but the $5238 level came in as a lower high. Then the next test of $5k was still in process on during yesterday’s webinar and that price was wobbling into the close, with sellers making a stark push this morning to break down to the $4856 level that set a higher low a month ago.
Gold Four-Hour Chart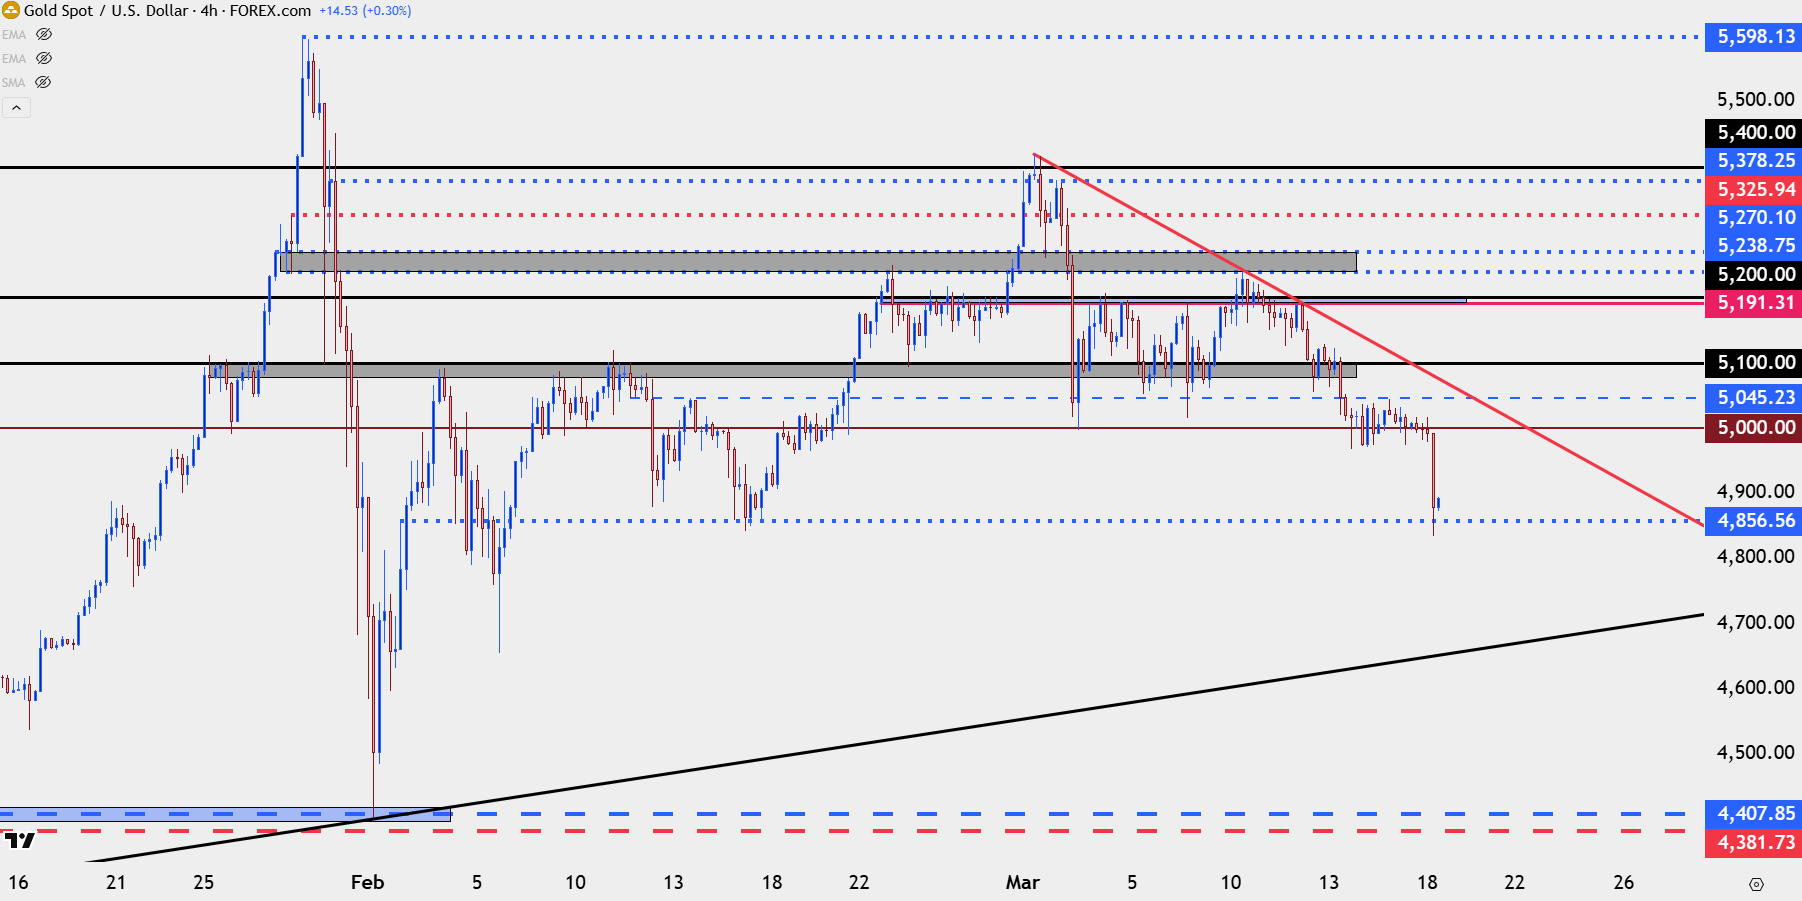
Chart prepared by James Stanley; data derived from Tradingview
From a zoomed in view on the four-hour chart gold is giving the perspective of distribution. As for causes, given that the sell-off started after the Iran war tension flared it probably makes sense to attribute at least some of that to the same theme that’s hit risk markets in several other areas.
But with that said, the ultimate test as to whether this is just longs cutting positions or the start of something larger will likely get more evidence when price pushes up to areas of possible lower-high resistance, such as the 4900 level, or the 4970 level that had come into play yesterday.
Gold Four-Hour Chart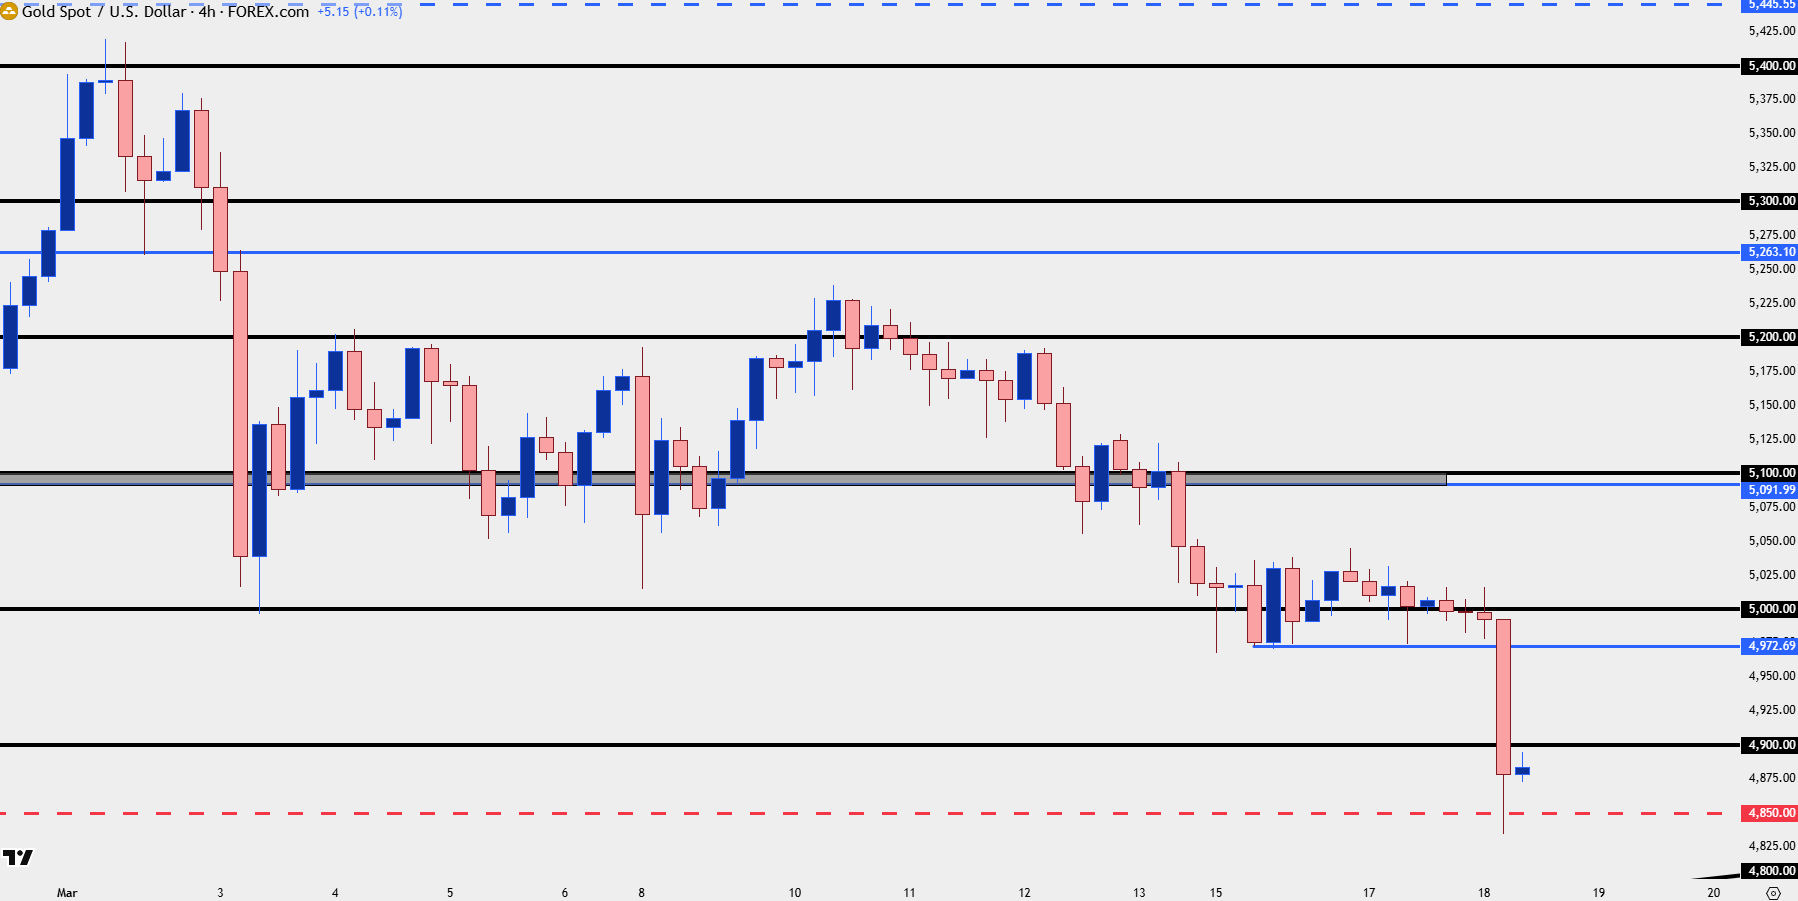
Chart prepared by James Stanley; data derived from Tradingview
Gold for Bulls
If you are harboring a bullish bias the name of the game at this point in time is patience, as gold is slicing in a series of lower-lows and highs. But there are a couple of things that biased buyers can watch for in effort of working with this pullback or retracement theme.
So far, the 4850 level has produced a bounce in gold and it’s still quite early, so there’s no evidence that a low is in-place. But, given the way the most recent hourly candle reacted with an extended underside wick, there could be scope for a higher-low if buyer step in to hold price above that prior low inflection point of 4834. The aim there would be risk minimization, so that if that point doesn’t ultimately come in as a higher-low the risk could be mitigated as gold further breaks down.
If looking to be even more patient, traders would want to wait for not only a higher-low, but a short-term higher-high to print to give evidence that buyers might be making their way back. It’s still too early given the current technical backdrop to project when or where that might happen.
Gold Hourly Chart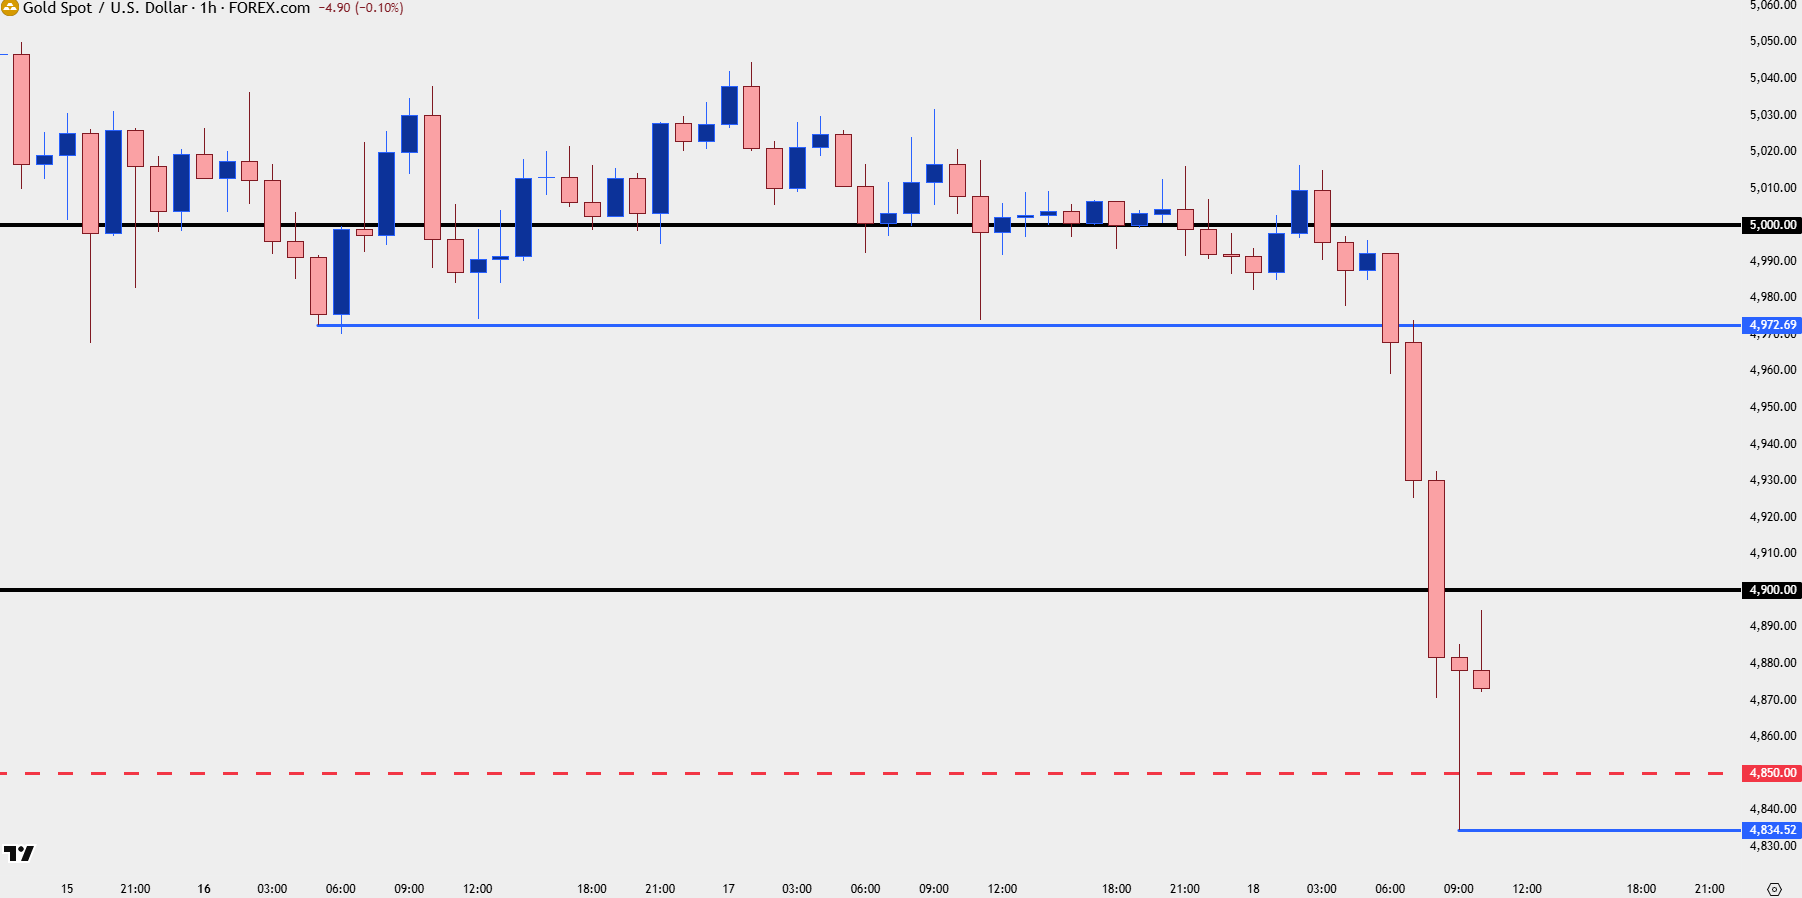
Chart prepared by James Stanley; data derived from Tradingview
Silver
Silver has similarly given up a big level after repeated tests of the 80-handle. But to my eyes, at least subjectively, this feels like it’s held up a bit better than this morning’s sell-off in gold.
In Silver futures it’s all about the 75 level which is confluent with the 50% marker of the 2025-2026 major move.
Silver Futures Daily Chart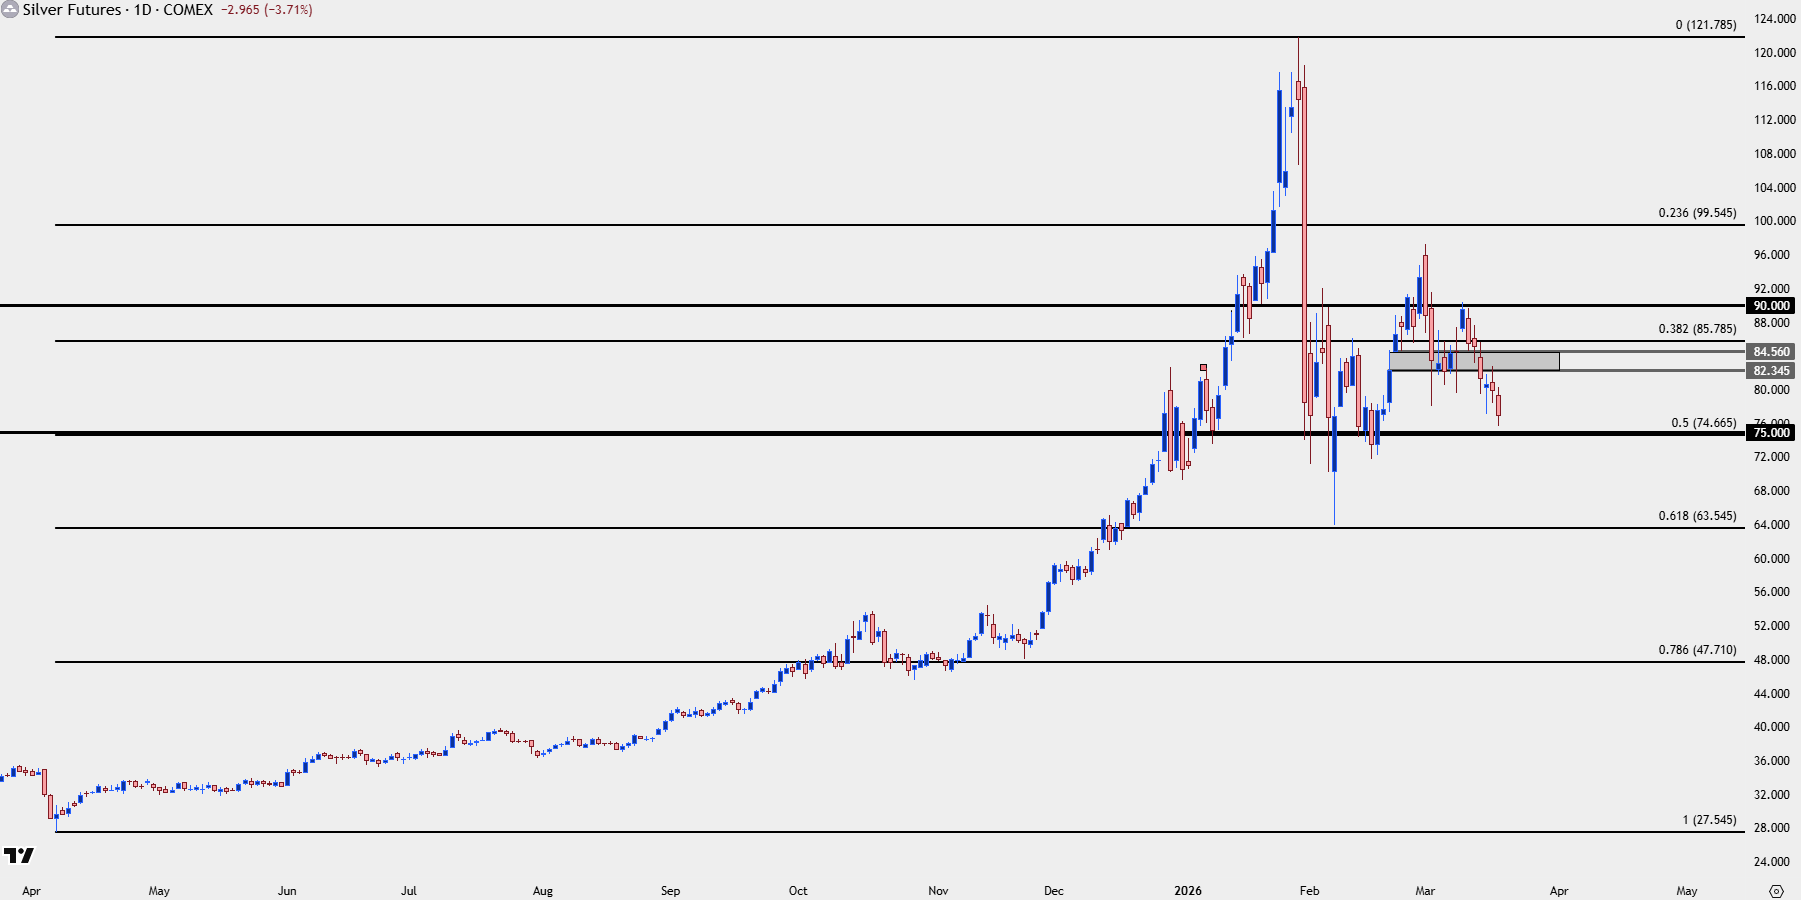
Chart prepared by James Stanley; data derived from Tradingview
Silver Four-Hour
While Silver is in distribution similar to gold above, again, the change appears to be less stark of late as sellers haven’t exactly been exploding with more supply on prints of fresh lows.
There are two bearish trendlines in play, however, and they make up a falling wedge pattern. These are often approached with aim of bearish reversals and the resistance side of the formation is confluent with a familiar zone, spanning from 82.35-84.56.
But, before that scenario can play we need to see buyers continue to defend that 75 handle, which I’ll look at in greater detail below.
Silver Four-Hour Chart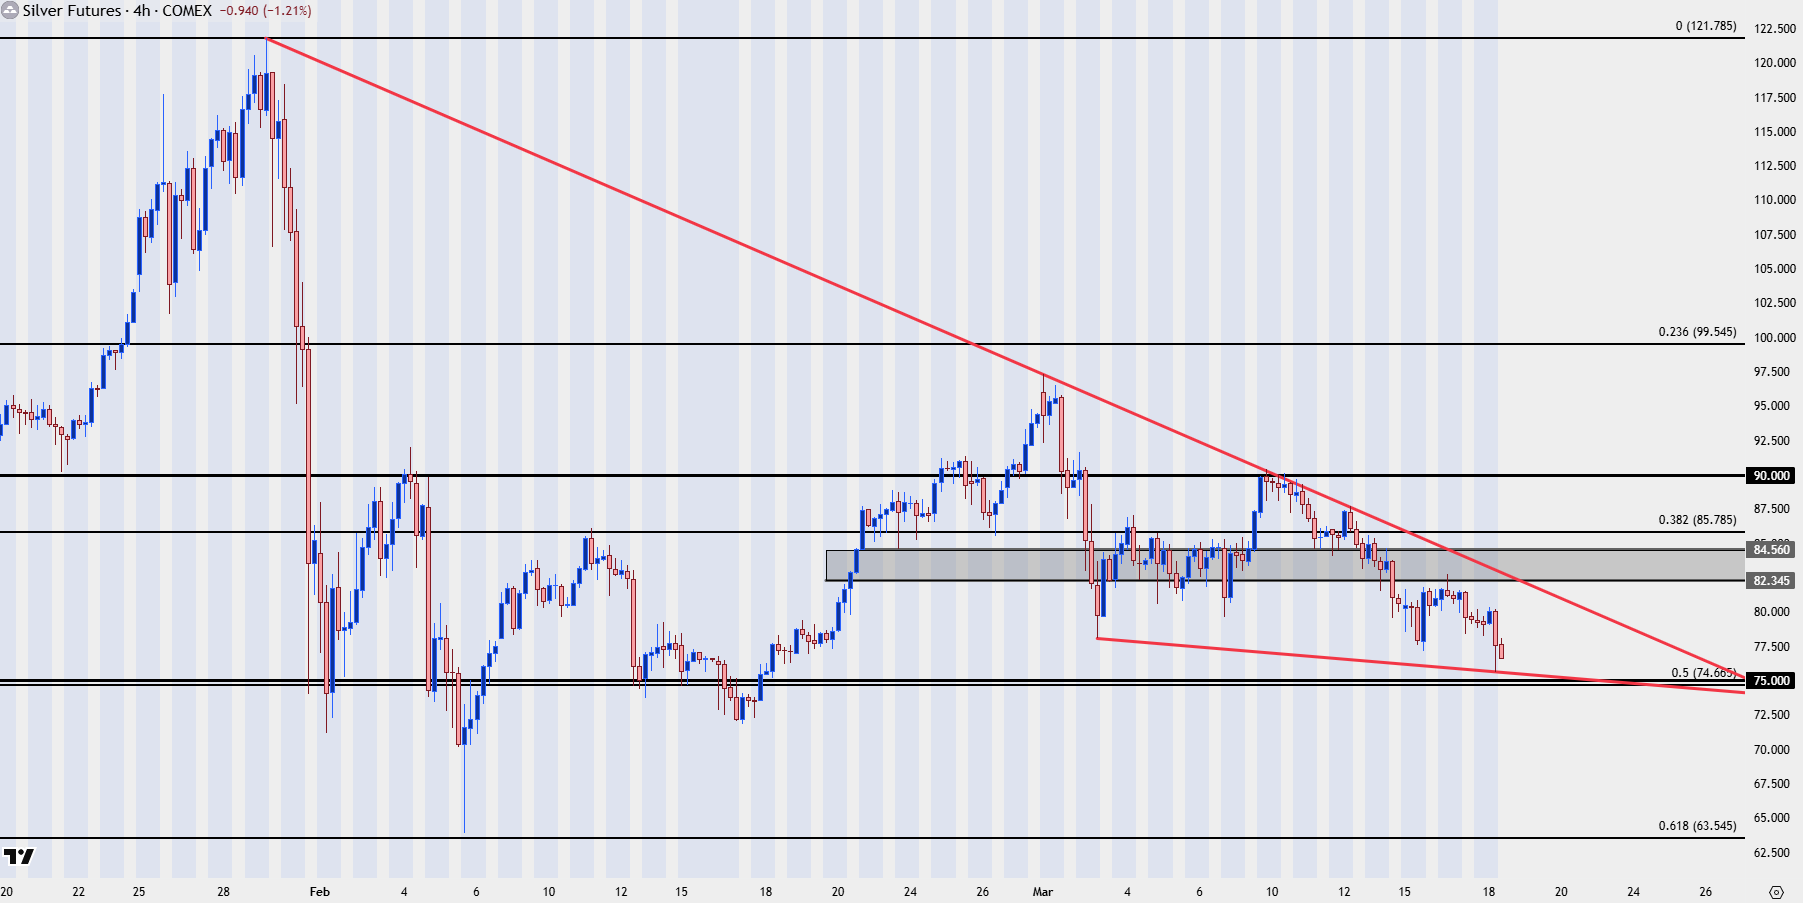
Chart prepared by James Stanley; data derived from Tradingview
Silver Short-Term
From the hourly chart on silver we have a similar pattern of lower-lows and highs, so this is difficult to justify on the long side just yet. The recent lower-high was right around the 80-level so that’s the spot that bulls need to beat, on a short-term basis, to exhibit an element of control for near-term trends.
But with that said, on a shorter-term basis, a defense of this morning’s swing-low with a higher-low showing, could similarly be approached as the above in gold, looking for an early-stage indication that sellers are slowing down and buyers are showing more anticipation. The swing low this morning in Silver futures printed right at 75.64, so that would be the line-in-the-sand to track as we go into today’s FOMC rate decision.
Silver Hourly Chart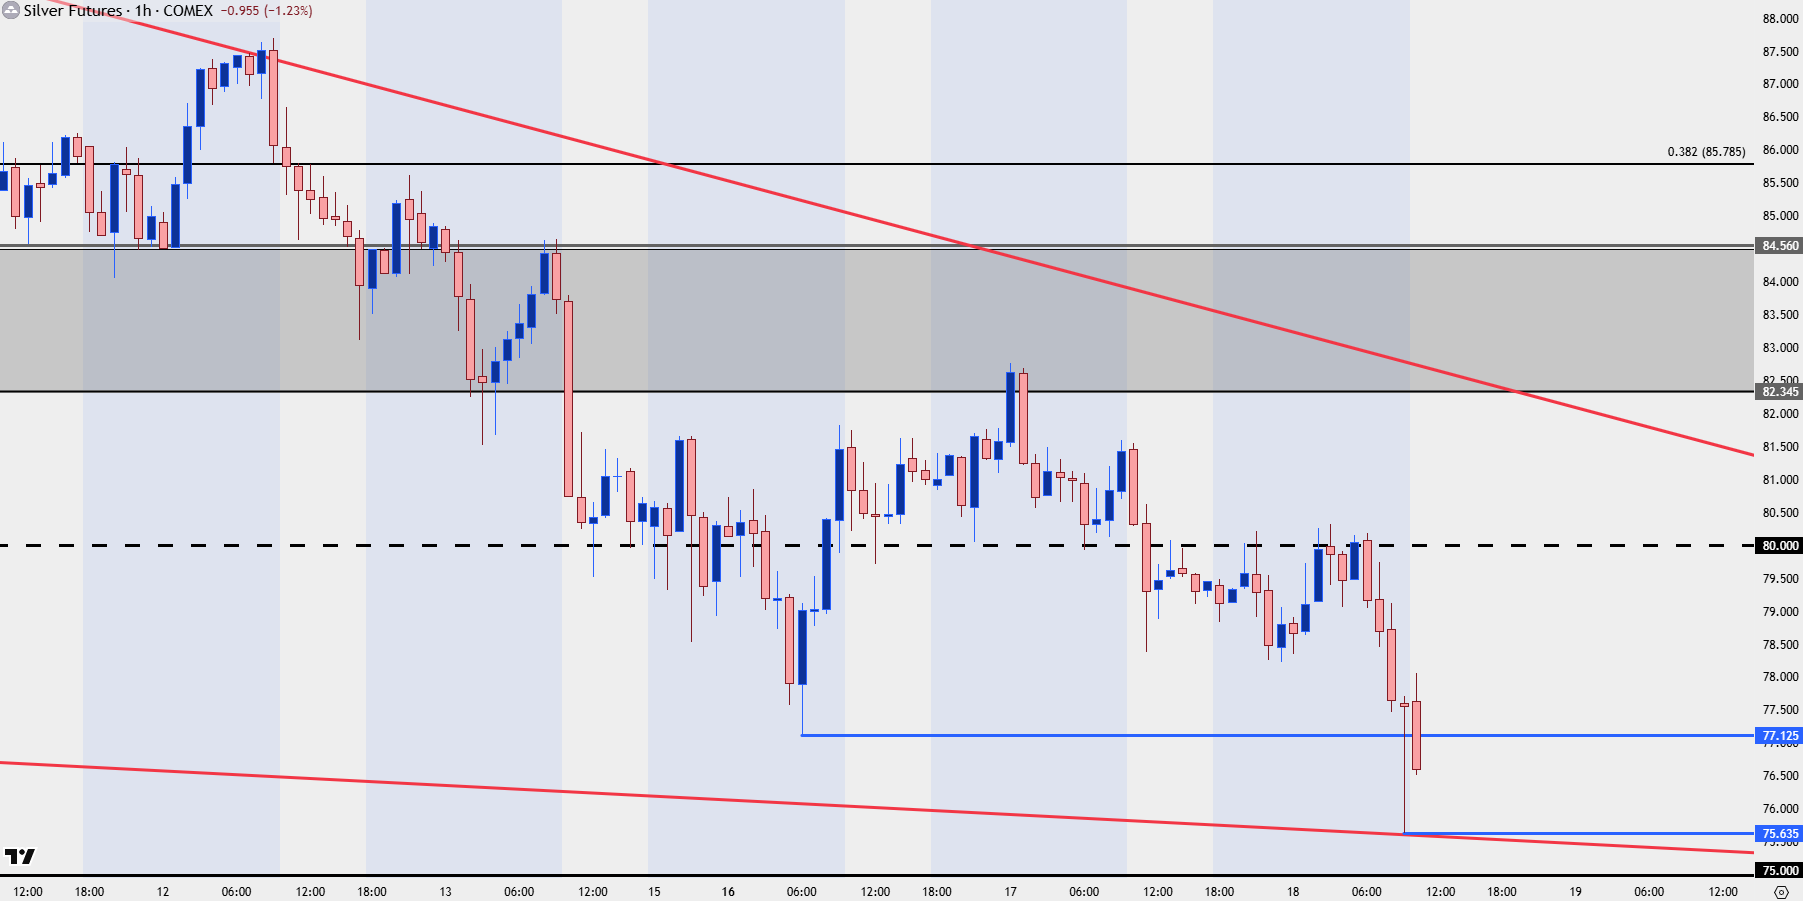
Chart prepared by James Stanley; data derived from Tradingview
--- written by James Stanley, Senior Market Analyst, Global Macro






