


Key Events
Silver has rallied sharply into record territory near the 62 mark ahead of the FOMC meeting and year-end momentum. This divergence raises questions about the sustainability of broader market trends that remain below their 2025 record highs.
The divergence is notable not only in price but also in sentiment — following a year of exhaustion triggered by policy shifts and tariff changes under the new presidency, which pushed markets into extreme pricing. Historically, a second-term presidency often aligns with consolidation phases, allowing markets to “reset” before the next bull cycle, as illustrated below.
SP 500 3-Month Outlook – Log Scale

Source: Tradingview
The S&P 500 is considered here relative to broader market performance and precious metals, particularly silver, given the increasing correlation between gold, silver, and U.S. indices.
The key question is whether silver is simply the last outperformer of an extended bull cycle or whether it is leading the next phase due to its rising importance in the expanding tech sector. Meanwhile:
- U.S. indices hold below major resistance levels
- Gold remains below 4200 — still more than 150 points away from its record
Only confirmed breaks above the 2025 records will determine whether markets move into a seasonal Santa Rally or continue consolidating.
While silver’s long-term outlook remains bullish in line with global tech and green-industry agendas, its current outperformance raises the risk of sharp pullbacks before the trend resumes.
Silver Outlook: Weekly Time Frame – Log Scale
Source: Tradingview
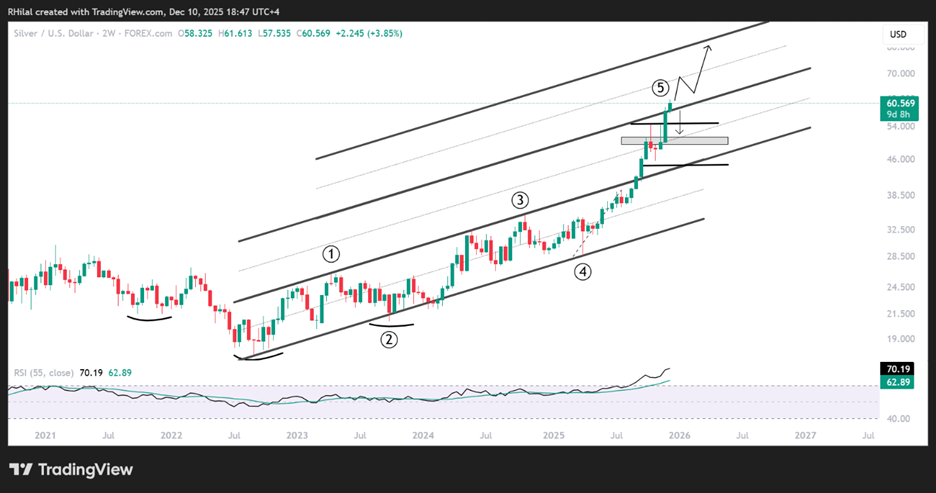
On the weekly chart, silver has pierced the upper boundary of a duplicated ascending channel that has contained price action since the 2022 lows — pushing the metal into a third duplicated channel, signaling an extended bullish bias.
From an Elliott Wave perspective, the fifth wave in commodities often extends, and silver’s current fifth wave from the 2022 impulse appears to be doing just that. This presents the following scenarios:
Upside Potential
If silver holds above 63, gains may extend toward the mid and upper boundaries of the third channel, aligning with 65 and 70, respectively.
Downside Potential
If silver dips back below the second channel’s upper boundary — under 57 — a retracement may realign with prior resistance zones that could turn into support near 55, 50, and in extreme cases 45, before the bullish trend resumes.
Silver Outlook: 3-Month Time Frame – Log Scale
Source: Trading view
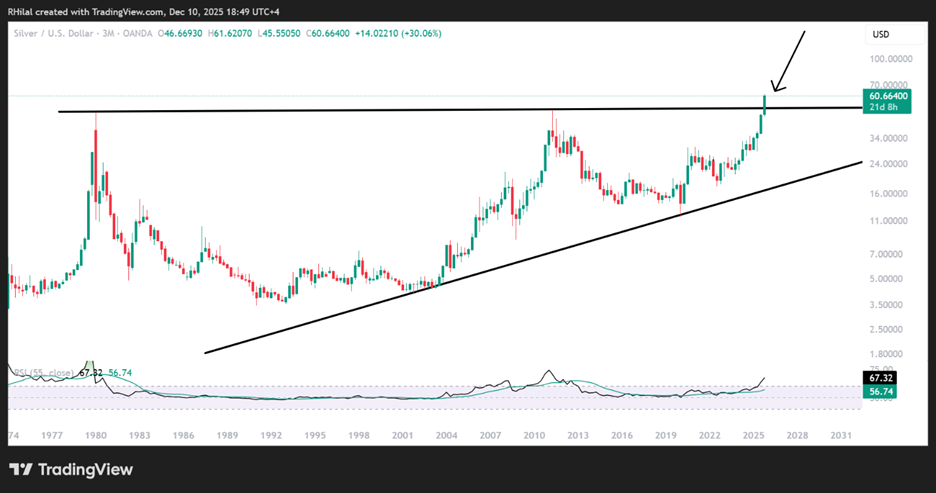
From a 3-month perspective, silver has broken through a 45-year resistance zone extending from the 1980s — clearing the 55 mark.
If momentum fades, reasonable retracement levels to reaffirm the breakout remain near 55, offering a structural “retest” before moving toward long-term triple-digit expectations.
As noted in the weekly chart, deeper corrective scenarios, especially under heightened volatility, could revisit 50 and 45, before potentially resuming the upward trajectory.
Written by Razan Hilal, CMT
Follow on X: @rh_waves






