- Silver prices set a fresh record high to open the week and crossed the 80-handle, but that was then met by intense selling that’s so far wiped out the entirety of Friday’s gains.
- There’s currently a bearish engulf showing on the daily and as shown in the below video, those can often show ahead of a larger pullback. But actually trading those formations is challenging given the distance to the high, so a shorter-term look is often necessary to take a risk-centric approach to working with reversal themes.
Silver was all the rage through the Christmas holidays and that even extended through this week’s open, with the metal rushing all the way up to and beyond the 80-handle to set a fresh all-time-high. But that enthusiasm couldn’t remain for long as profit taking soon took over, and at this point, the Monday candle is showing as a bearish engulf as sellers have erased the entirety of Friday’s gains and then some.
As highlighted in the above video, this doesn’t necessarily mean doom and gloom, although bearish engulfs can often show ahead of a significant reversal or pullback theme.
Silver Daily Chart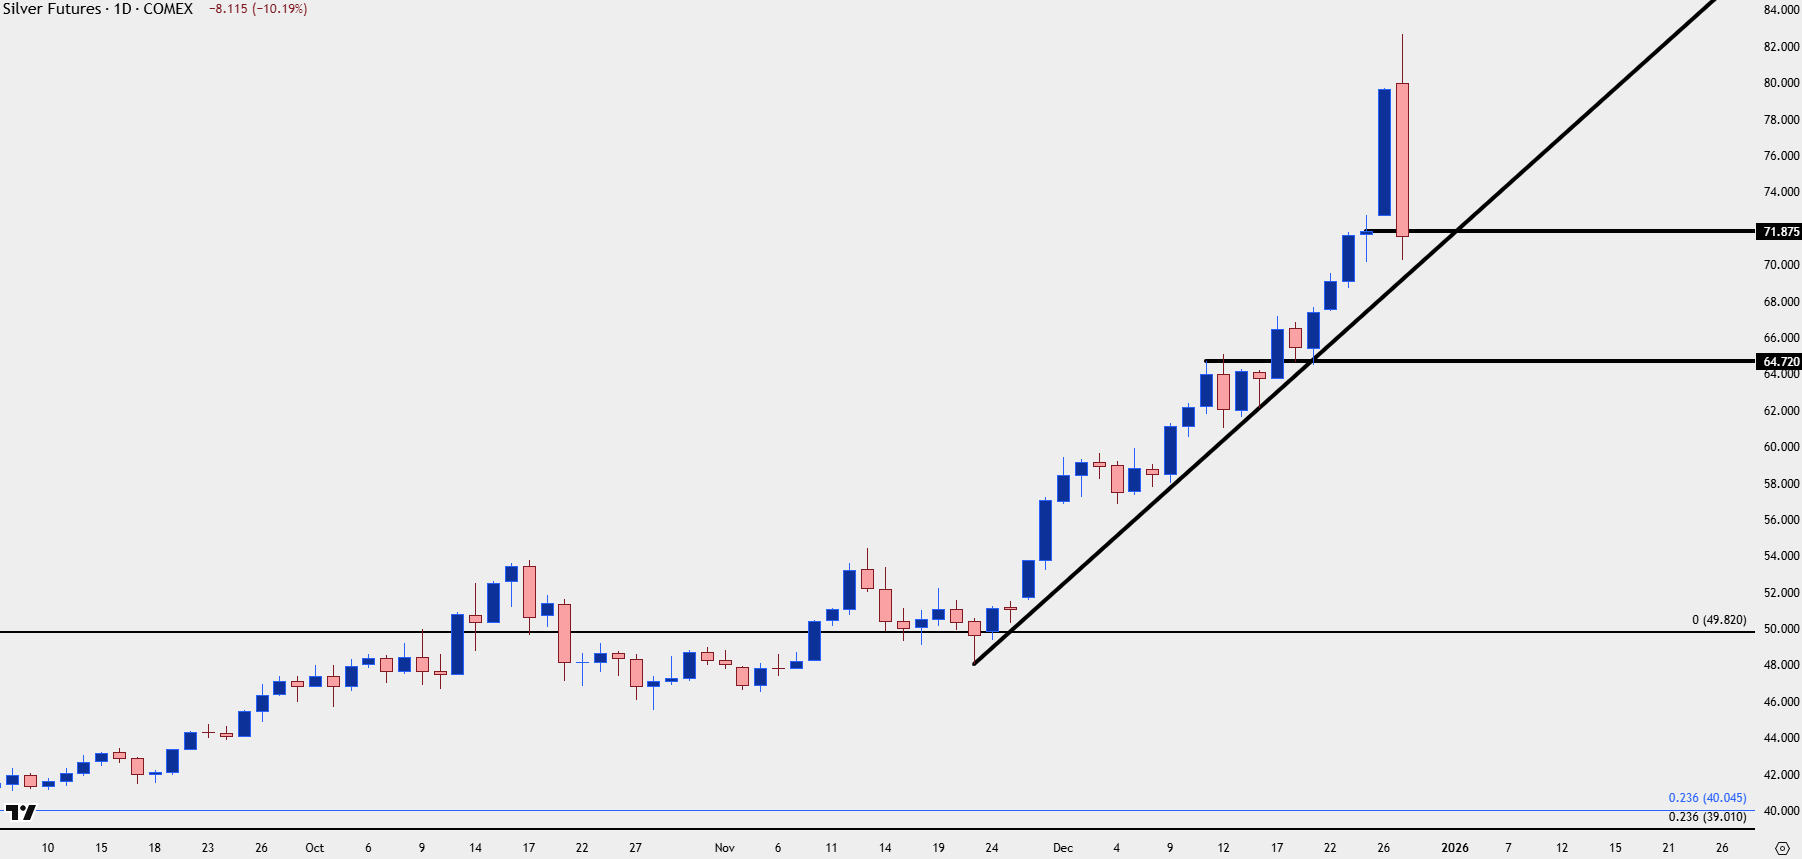
Chart prepared by James Stanley; data derived from Tradingview
USD Holds the Gap
The year of 2025 was an easy one to be a USD bear as President Trump took an aggressive approach towards pushing the currency lower. In his back pocket for much of the year was the Fed Chair nomination, and he’s even said that a willingness to cut rates was a ‘litmus test’ for who he’d select to lead the bank next. That’s likely played a role into the 75 bps of cuts that the Fed pushed in the final four months of the year but really it was the lead-in to that when the Dollar was at its weakest.
And remember, it was as we came into 2025 that the USD was a runaway freight train with analysts across the world forecasting a parity run in EUR/USD which never ended up happening. The USD set its high within the first two weeks of the year, and EUR/USD it’s low, and then the rest of H1 25 was spent with both markets going in the opposite direction.
As we go into 2026 it seems there’s few if any USD bulls in sight, but notably, with US growth pushing higher the USD is working on its second consecutive quarterly gain. Sellers have continually been stymied around current support, and the weekly chart illustrates that well.
USD Weekly Chart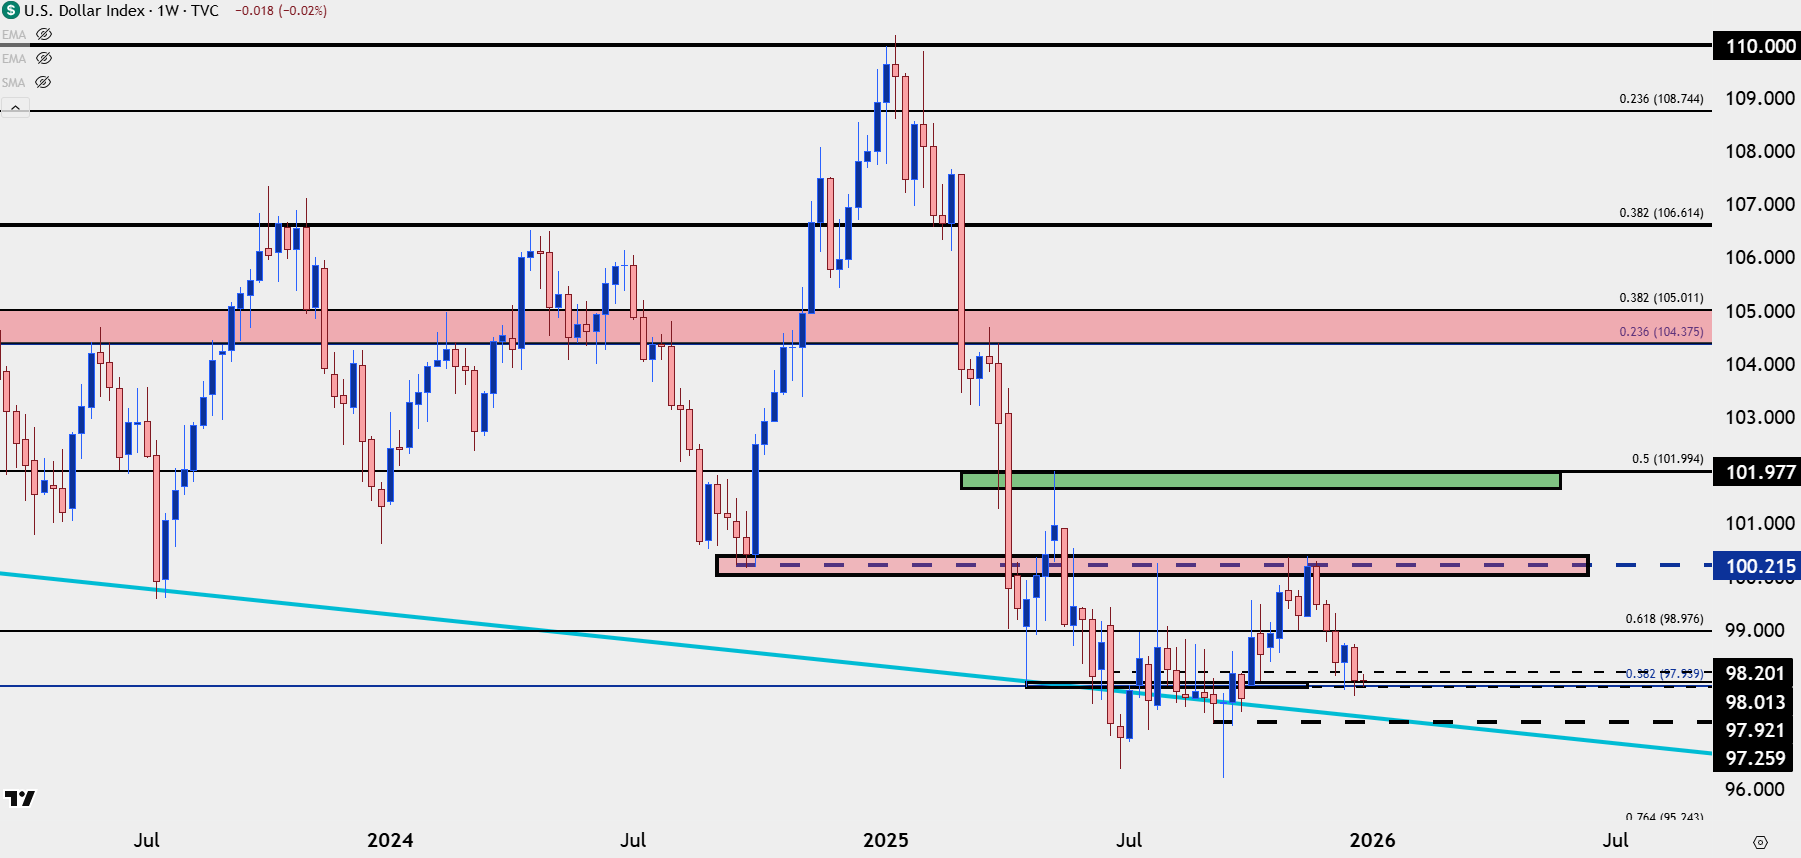
Chart prepared by James Stanley; data derived from Tradingview
--- written by James Stanley, Senior Market Analyst, Global Macro