
The start of the trading week has been unfavorable for the S&P 500, as recent sessions have been marked by a growing sense of neutrality, resulting in a decline of more than 1.2% on the day. Selling pressure has begun to gain traction, driven by declines in several of the index’s largest components and by the lack of meaningful macroeconomic catalysts capable of restoring confidence. This backdrop has led to persistent weakness, which could evolve into a broader indecisive environment over the coming sessions.

Buying momentum fails to consolidate
With the start of February and amid a key earnings season, indecision in SPX price action has become increasingly evident. So far, important earnings reports from some of the index’s largest constituents have already been released:
- Apple reported earnings on January 29, 2026, posting revenue of $143 billion, representing approximately 16% year-over-year growth. However, the stock failed to deliver a strong post-earnings rally and has gained around 6% since the announcement.
- Microsoft, which reported on January 28, delivered revenue of roughly $81 billion, beating consensus expectations. Despite this, markets have grown increasingly concerned about the rising costs associated with artificial intelligence, particularly given the lack of immediate monetization. These concerns have weighed on long-term expectations, and the stock has fallen around 15% since its earnings release.
Earnings are still pending from Google, scheduled for February 4, Amazon, set to report on February 5, and Nvidia, expected to release results on February 25.
In this context, earnings season has produced a mixed sentiment, rather than a clear recovery in confidence. Some results have failed to reinforce a positive outlook, while other key reports remain outstanding, reinforcing a cautious tone across the market.
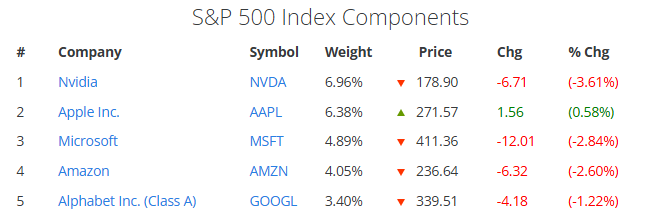
At present, most of the index’s major components are showing weakness. Within the top five, Nvidia is down 3.61%, Microsoft has fallen 2.84%, and Amazon is lower by 2.6%, while Google is down 1.22%, with both stocks under pressure ahead of their upcoming earnings releases. Apple stands out as the exception, up around 0.58%, still supported by its solid recent results.
Source: Slickcharts
Taken together, earnings season has yet to stabilize short-term confidence in major equities. The market remains focused on upcoming reports, which continues to limit upside momentum in the index during recent sessions.
The macro backdrop continues to weigh
Beyond corporate earnings, a key factor influencing equity market confidence remains U.S. interest rate policy. Since last week, markets have priced in a neutral rate outlook for at least the next two Federal Reserve meetings, with rates expected to remain at 3.75%.
In the absence of clear signals pointing to lower interest rates, elevated borrowing costs continue to weigh on debt dynamics and could limit consumer activity, creating an environment that is not conducive to a strong recovery in equity market confidence in the short term.
As a result, the combination of a neutral central bank stance and a mixed earnings season has acted as a key catalyst behind the index’s current weakness. While conditions could shift as additional earnings reports are released, for now, indecision and caution have regained relevance and may give way to more sustained downside pressure in the sessions ahead.
S&P 500 Technical Outlook
Source: StoneX, Tradingview
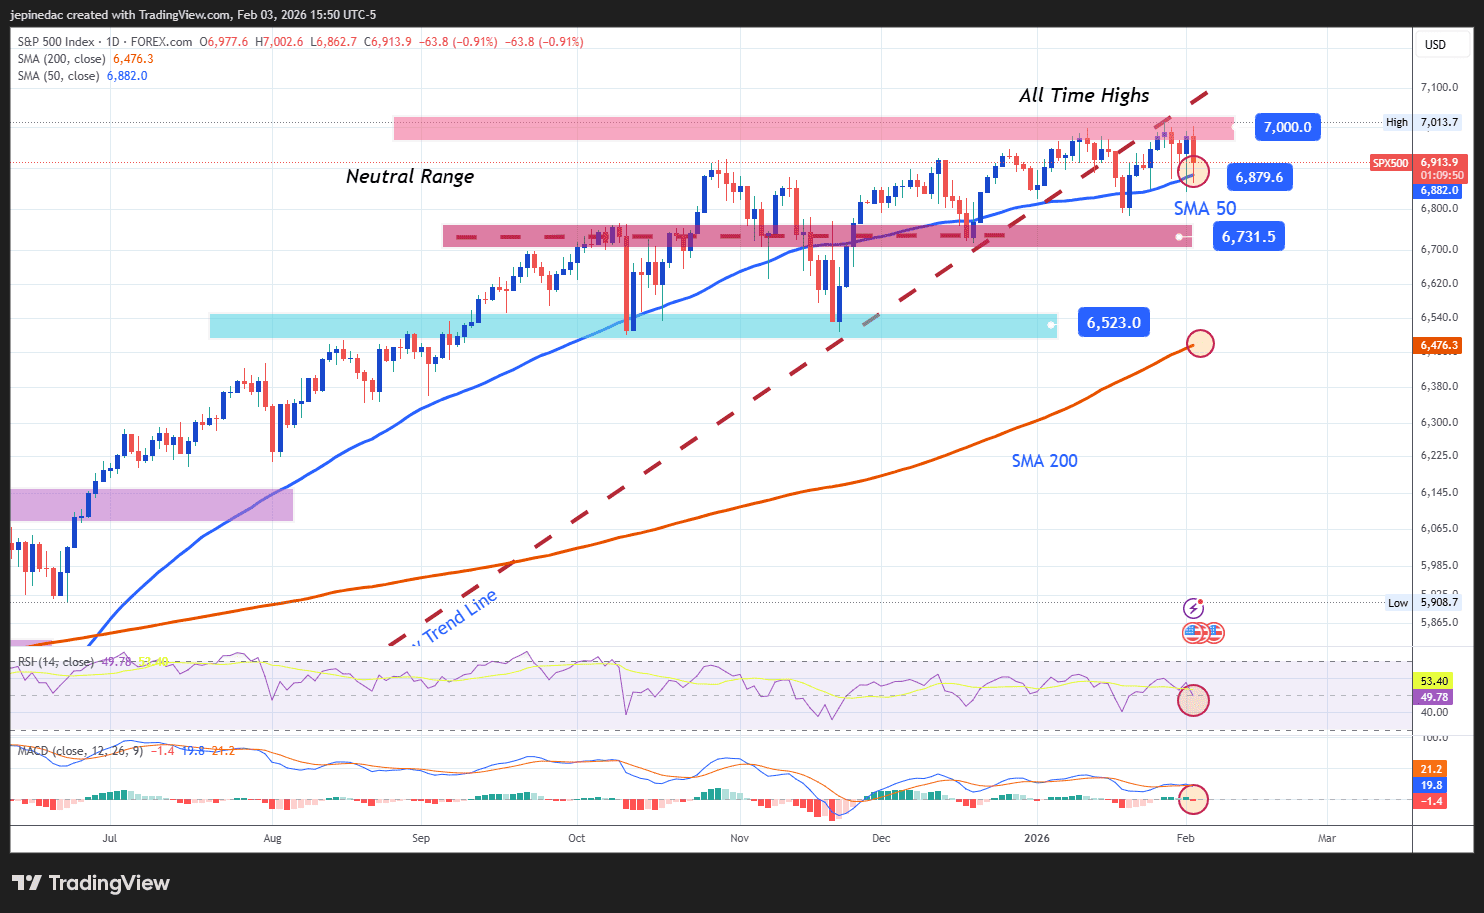
- Sideways range remains dominant: Over the past several months, SPX price action has maintained a neutral bias, failing to develop a clear directional move. A sideways range, capped near 7,000 points and supported around 6,700 points, has contained most of the index’s movements and remains the most relevant technical structure in the short term. As long as these levels hold, it will be difficult for a more defined trend to emerge, preserving an environment of indecision that could even open the door to additional weakness.
- RSI: The RSI has started to cross below the neutral 50 level, suggesting that selling momentum is beginning to regain control over the average price action of the past 14 sessions. If the indicator continues to decline, it could reinforce a more dominant bearish bias in the near term.
- MACD: A similar signal is emerging in the MACD, with the histogram slipping slightly below the zero line, indicating that short-term moving average momentum is turning bearish. If this behavior persists, it could open the door to more consistent downside pressure in the index.
Key levels:
- 7,000 points – Key resistance: This level coincides with the index’s record highs and represents a major psychological barrier. A sustained breakout above this zone could reactivate a stronger bullish bias and pave the way for a potential short-term uptrend.
- 6,879 points – Nearby barrier: A neutral zone aligned with the 50-period simple moving average. Prolonged price action around this level could help preserve the current sideways range.
- 6,731 points – Key support: This level marks the most relevant lows of recent months and defines the lower boundary of the range. Sustained moves below this zone could trigger a more dominant bearish phase over the coming weeks.
Written by Julian Pineda, CFA, CMT – Market Analyst
Follow him on: @julianpineda25