
Key Events
- DXY pulls back below the 98 mark on renewed tariff concerns, boosting EURUSD back above 1.18 and gold above 5,100.
- Trump aims to implement a 15% tariff blanket after the Supreme Court rejected the 10%, reviving April 2025 drawdown risks across the dollar, energy, and risk assets, while keeping haven assets and major currencies supported.
- Key technical levels continue to hold, helping confirm whether moves across DXY, EURUSD, and Gold reflect structural shifts or merely headline-driven volatility.
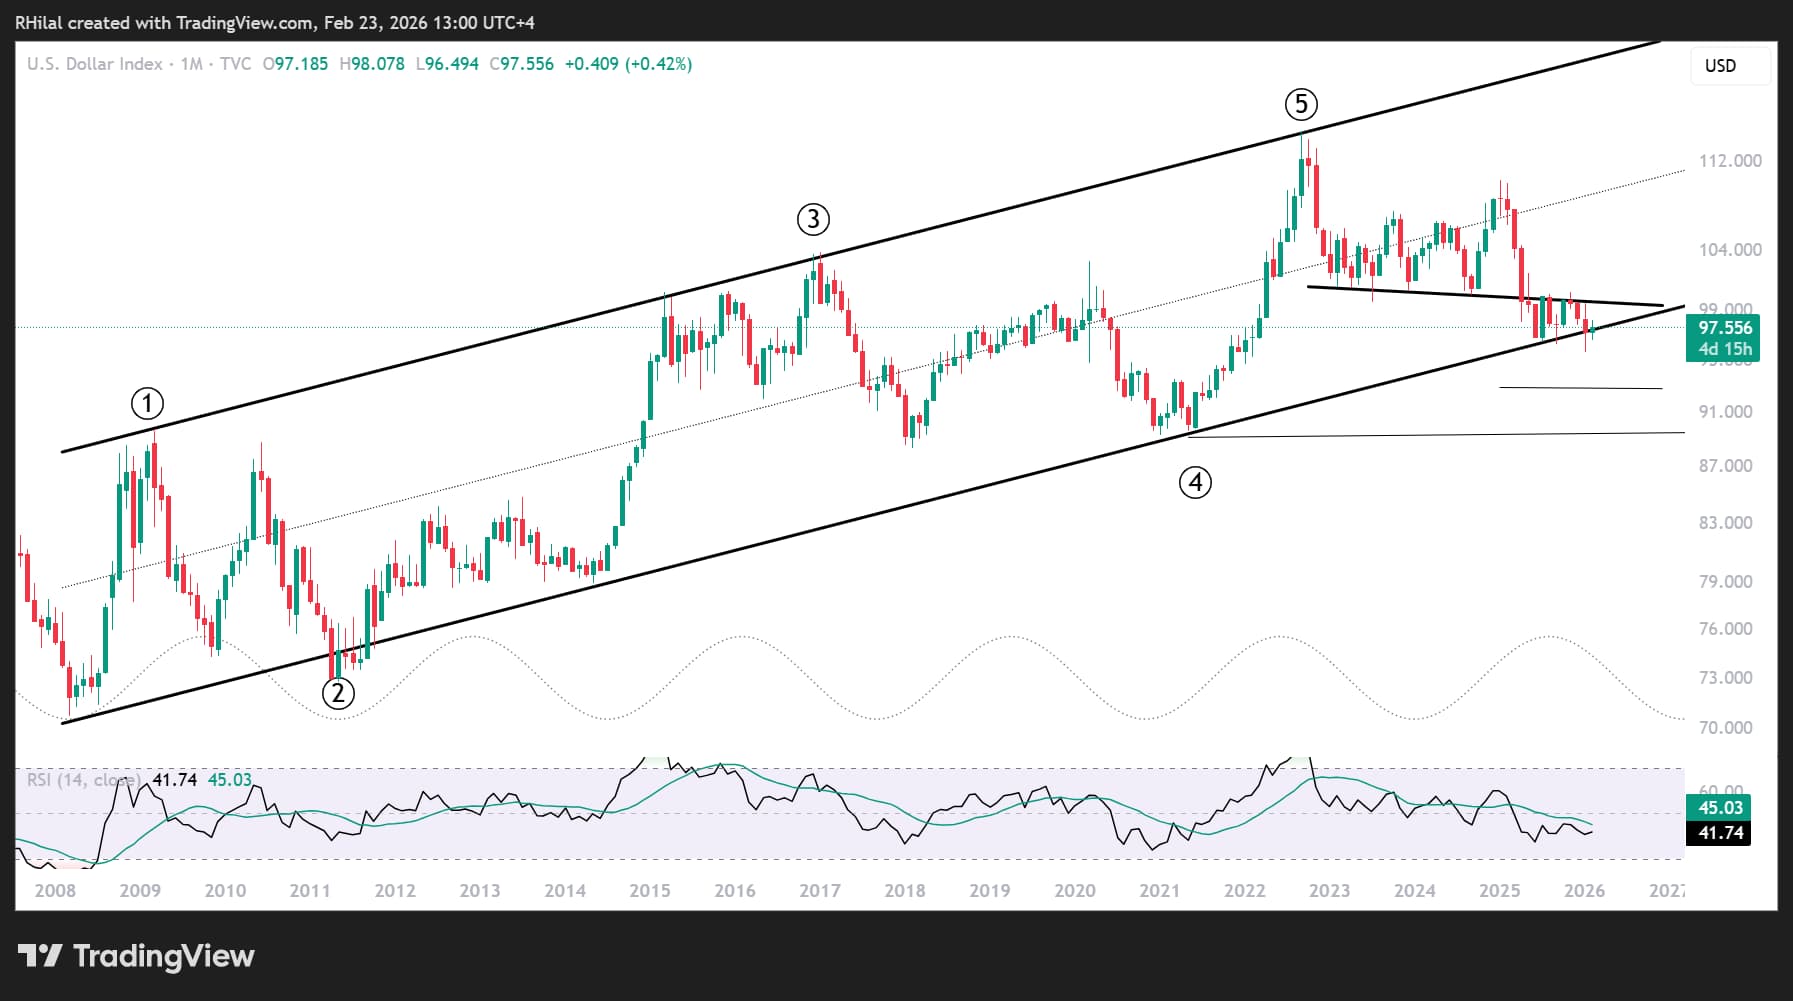
If you’ve been following my articles, you’ve likely seen this chart several times. I use it to monitor the long-term structure of the DXY amid volatile headlines driven by geopolitical tensions, economic data, Fed rate expectations, and tariffs.
DXY Outlook: Monthly Time Frame – Log Scale
Source: Trading view
The DXY’s latest pullback from the 98 resistance level has revived bearish concerns as price continues to hold the 2008–2026 ascending trendline. The sharp wick along that boundary in February preserves a bullish bias despite current headlines — unless we see a monthly close below the 97 and 96 marks, which would expose a structural shift in the pattern.
For now, consolidation below the 100 mark remains in play until a decisive breakout occurs in either direction, keeping the broader uptrend technically intact.
Translating this reading into EURUSD and Gold:

- EURUSD is trading back above 1.18, but remains below the 1.1950 resistance and yearly highs.
- Gold is trading back above 5,100, but still faces resistance at 5,300 and 5,600 before confirming a continuation toward the 6,000 threshold.
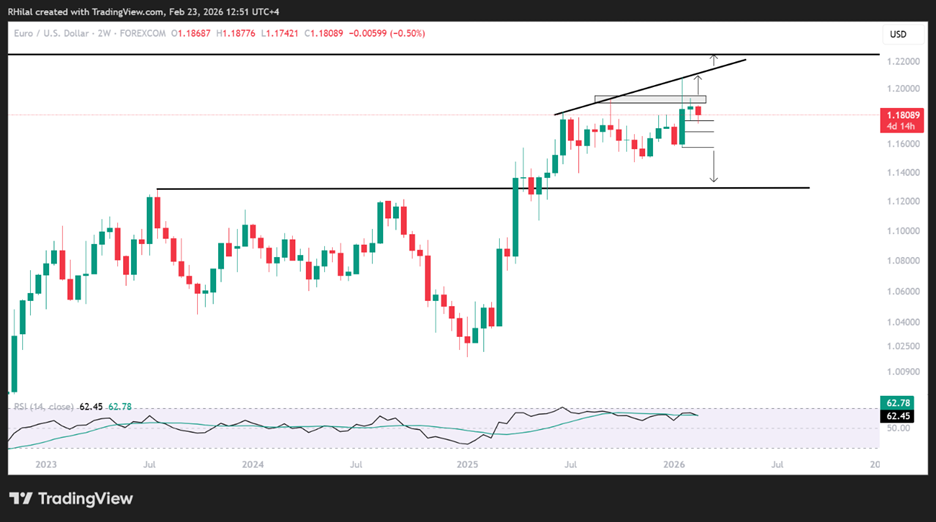
EURUSD Outlook: Two Week Time Frame – Log Scale
Source: Trading view
On the two week chart, EURUSD is facing resistance connecting consecutive higher highs since June 2025, capping gains below the key 1.1950 zone. A daily or weekly close above this level is required to reassert bullish bias toward 1.20, before potentially extending toward the 2022 and 2018 highs near 1.23 and 1.25 respectively.
That outlines the bullish scenario. However, recent price action is turning lower, with downside risks building. A break below 1.1760, which represents the 0.618 retracement of the 2026 advance, could open the door to deeper drawdowns toward:
• 1.1680
• 1.1580
The 1.1580 level becomes pivotal. A hold there could revive bullish momentum. Failure to stabilize may expose the 1.12–1.11 zone, a scenario in which renewed dollar strength takes control.
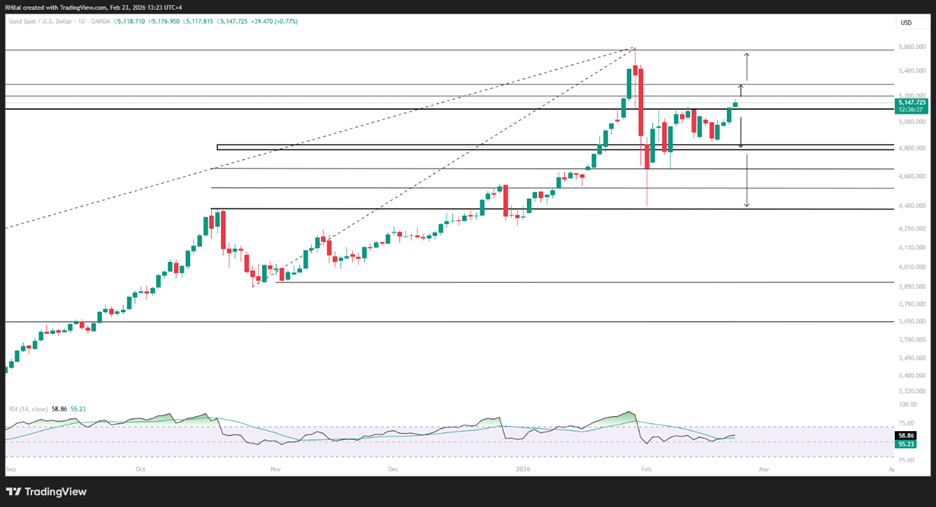
Gold Outlook: Two Week Time Frame – Log Scale
Source: Trading view
Gold prices are holding above the 5,100 mark following margin and liquidity adjustments earlier this year amid the 1,000 point swings. This maintains a bullish bias from a short-term perspective.
A clean hold above 5,200 would extend the next 100-point projection toward 5,300 — a key barrier separating a renewed long-term bullish push toward record highs and the 6,000 threshold, from a potential corrective drawdown back toward the 4,800 and 4,400 support levels. Closing below 4,400 would likely expose another 1,000-point drop.
Written by Razan Hilal, CMT
Follow on X: @Rh_waves