
Key Events
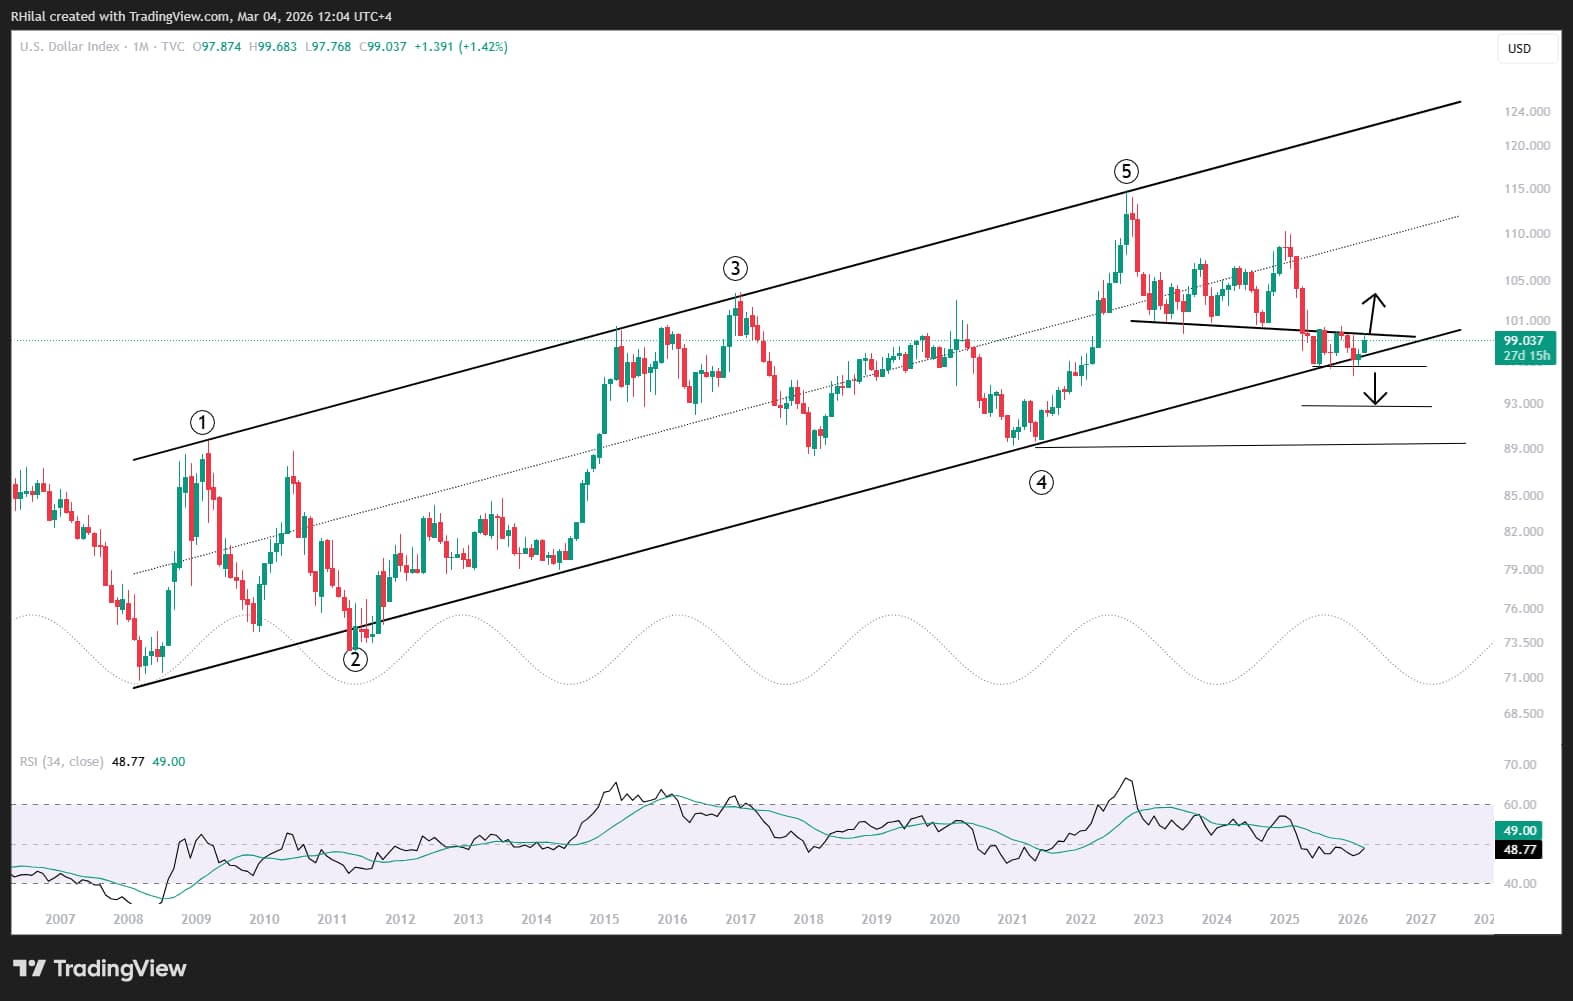
• DXY retests 99.50 resistance, a defining barrier for a longer-term bullish bias
• Supply disruption risks across the Middle East, including Qatar, Saudi Arabia, Iraq, and Iran, lift global energy prices, inflation concerns, and dollar pairs
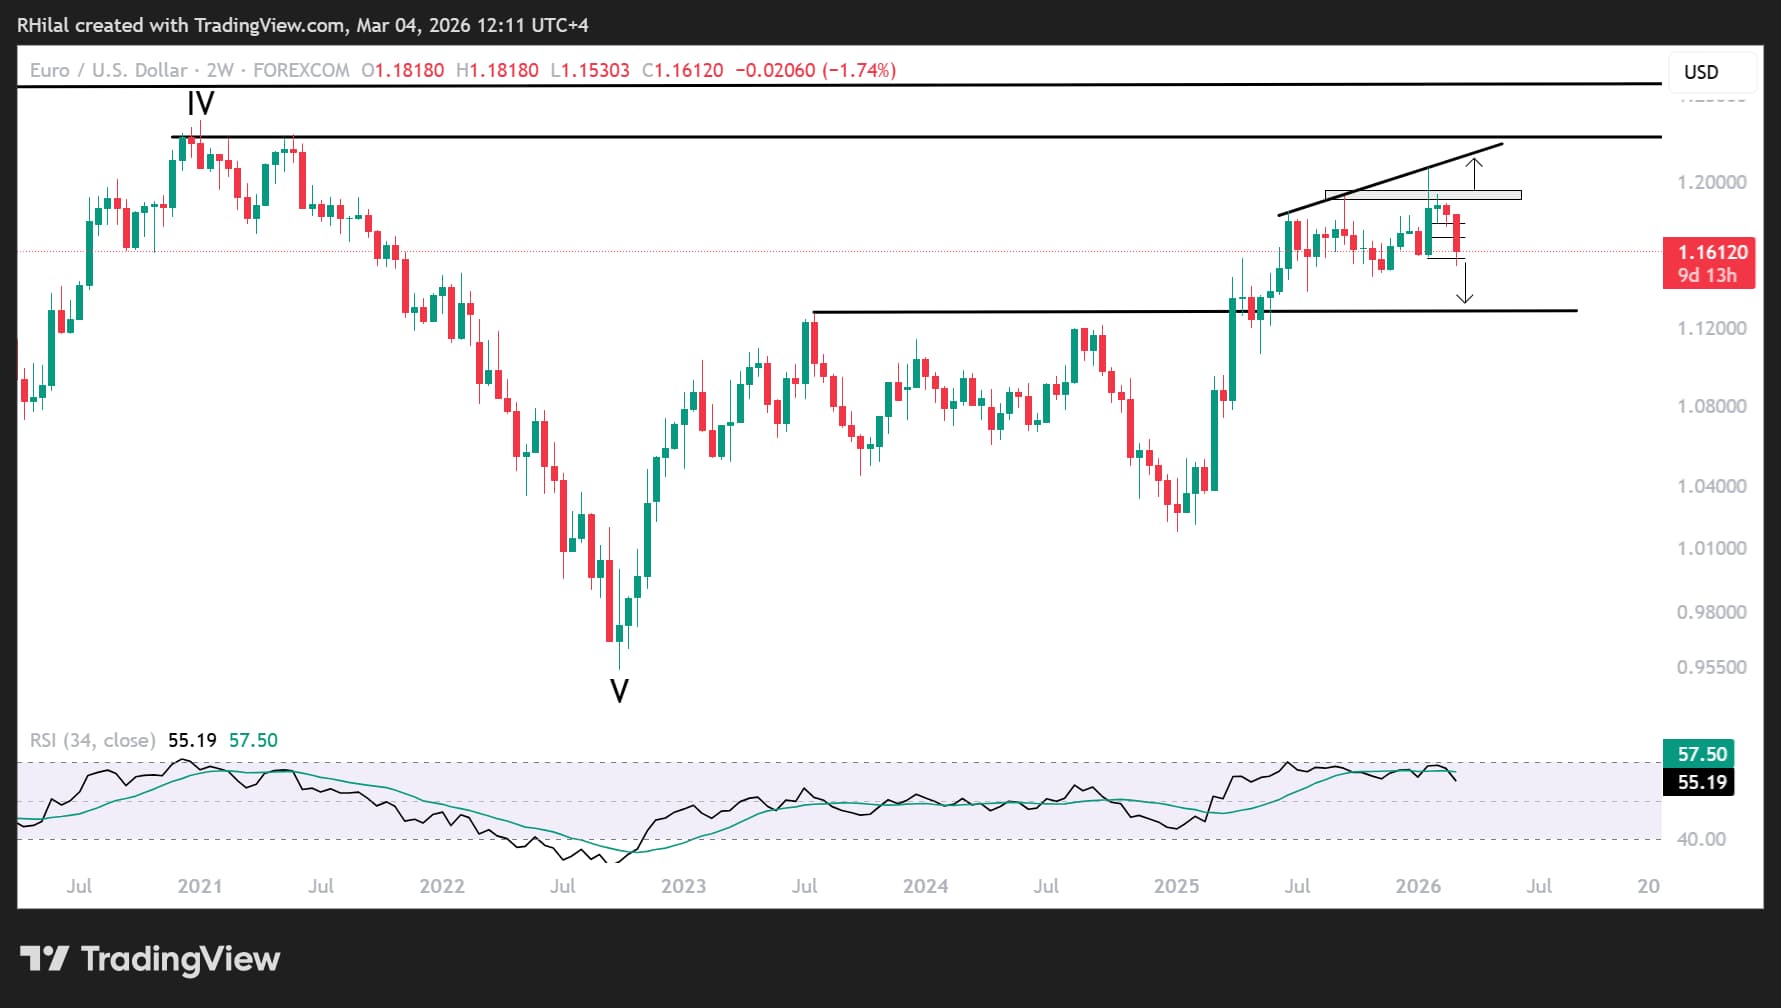
• EURUSD is trying to hold above 1.16, GBPUSD above 1.33. Is another drop on the way?
Middle East escalations took a few days to fully reflect across markets. The closure of the Strait of Hormuz was not expected to extend for long, yet the broader regional escalation has. Energy disruptions across the region, notably with targets on ports and facilities in Saudi Arabia, Iraq, Qatar, and Iran, lifted energy prices across the globe, pressuring indices into steep downturns and pushing dollar pairs higher against major currencies.

As Brent soars into the 80s zone, WTI trades firmly higher above 70, and gas prices lift over 6%, inflation concerns have resurged, realigning central bank expectations toward prolonged rate holds until tensions ease. Rising energy prices have strengthened the dollar’s rebound while deepening global equity declines, especially in energy-dependent economies. The Nikkei, DAX, and Kospi (largest drop on record) saw steep drops, alongside Middle East markets, while US indices remained relatively more stable, yet still bearish.
In times of extreme momentum, contrarian interest tends to emerge, particularly when overbought and oversold readings reach extremes on the charts. I covered the key levels for gold, silver, and crude oil in the following articles:
Gold, Silver Outlook: Dollar Strength Caps Haven Rally Amid Hormuz Risks
WTI Forecast: Hormuz Risks, Aramco Impact, and OPEC Supply
Below is the currency outlook as central banks lean toward hawkish holds and inflation caution.
DXY Outlook: Monthly Time Frame – Log Scale
Source: Trading View
Despite the dollar’s broader bullish bias within the uptrend extending from 2008 to 2026, price action has now returned to a key resistance zone, connecting highs and lows since February 2023. This area may either act as resistance within a broader bearish channel or serve as the breakout barrier for a renewed bullish continuation.
Key levels stand above 99.50 and 100.40, after which DXY could extend toward 102 and 105. On the downside, failure to hold above 99.50 may resume consolidation between 98 and 96.50. A break below 96.50 opens the path toward the 2021 lows near 92 and 89.
Translating that scenario to the euro
EURUSD: 2-Week Time Frame – Log Scale
Source: TradingView
From a two-week perspective, EURUSD is attempting to hold above the 2026 lows near the 1.1580 support, while RSI leans bearish, turning lower from overbought levels last seen in 2021. This defines the following scenarios:
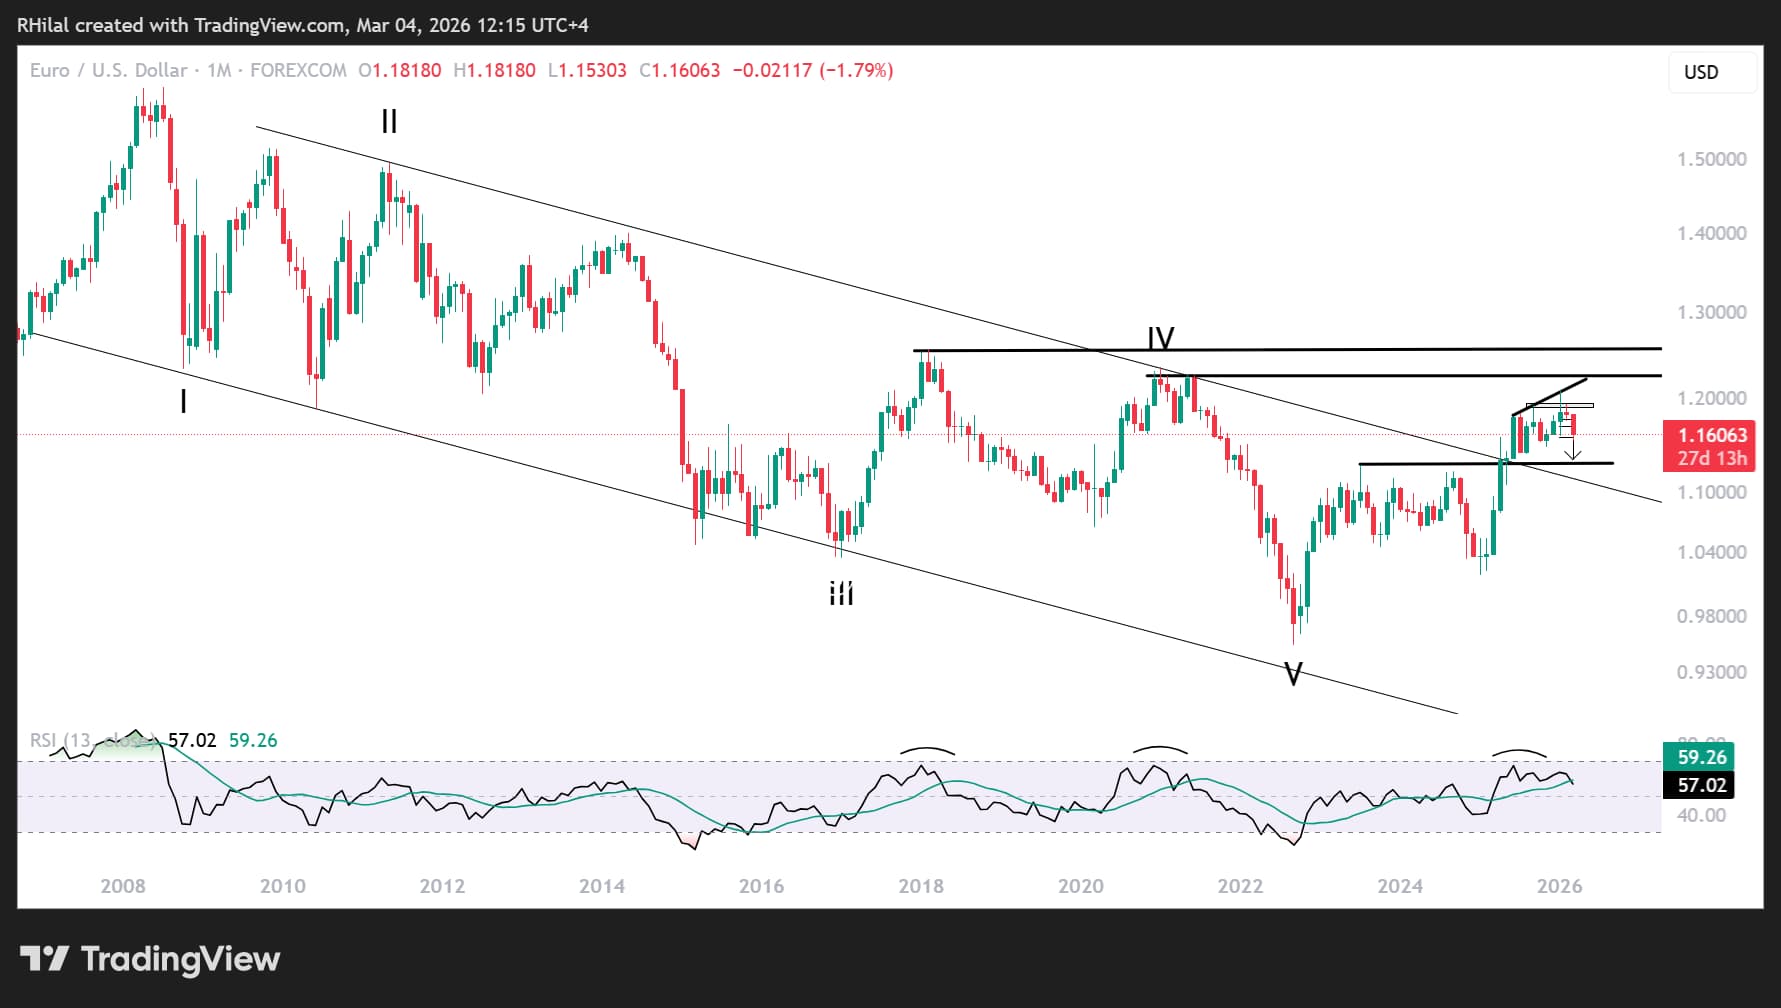
A close below 1.1580 exposes 1.1480 and 1.13, before potentially extending toward the 1.11 zone. That area aligns the pair with the upper boundary of its 2008–2025 channel, opening the debate between a bullish rebound or renewed bearish pressure against the DXY.
EURUSD: Monthly Time Frame – Log Scale
Source: TradingView
Written by Razan Hilal, CMT
Follow on X: @Rh_waves