

I think the Oil trade still holds sway over larger macro themes and over the past couple of weeks, there’s been a shared relationship of higher oil prices and a stronger USD although I think that relationship might be a bit misunderstood.
The common linkage between the two are currencies of oil vulnerable economies, like the Euro and Japanese Yen. As oil prices shot-higher, a larger risk showed in economies more dependent on importing oil, and that, in-turn, led to weakness in the Euro and British Pound or Japanese Yen and that then manifested in a pattern of USD-strength. Those three currencies are the three largest components of the DXY basket, so while it’s simple to associate oil driving risk aversion which then drives USD-strength, the actual relationship underpinning that association is a bit more nuanced.
The reason for pointing this out is that there’s a bit of divergence at the moment, as oil prices have scaled back pretty aggressively and the USD, so far, hasn’t. There’s still a claim to bullish structure on the daily chart of the USD and I think tomorrow’s CPI report could have a large bearing on whether that changes.
For now, it’s the 97.94 level of prior resistance that looms large in the DXY basket as this held multiple highs until last week’s breakout, and it so far hasn’t been tested for support.
US Dollar Four-Hour Price Chart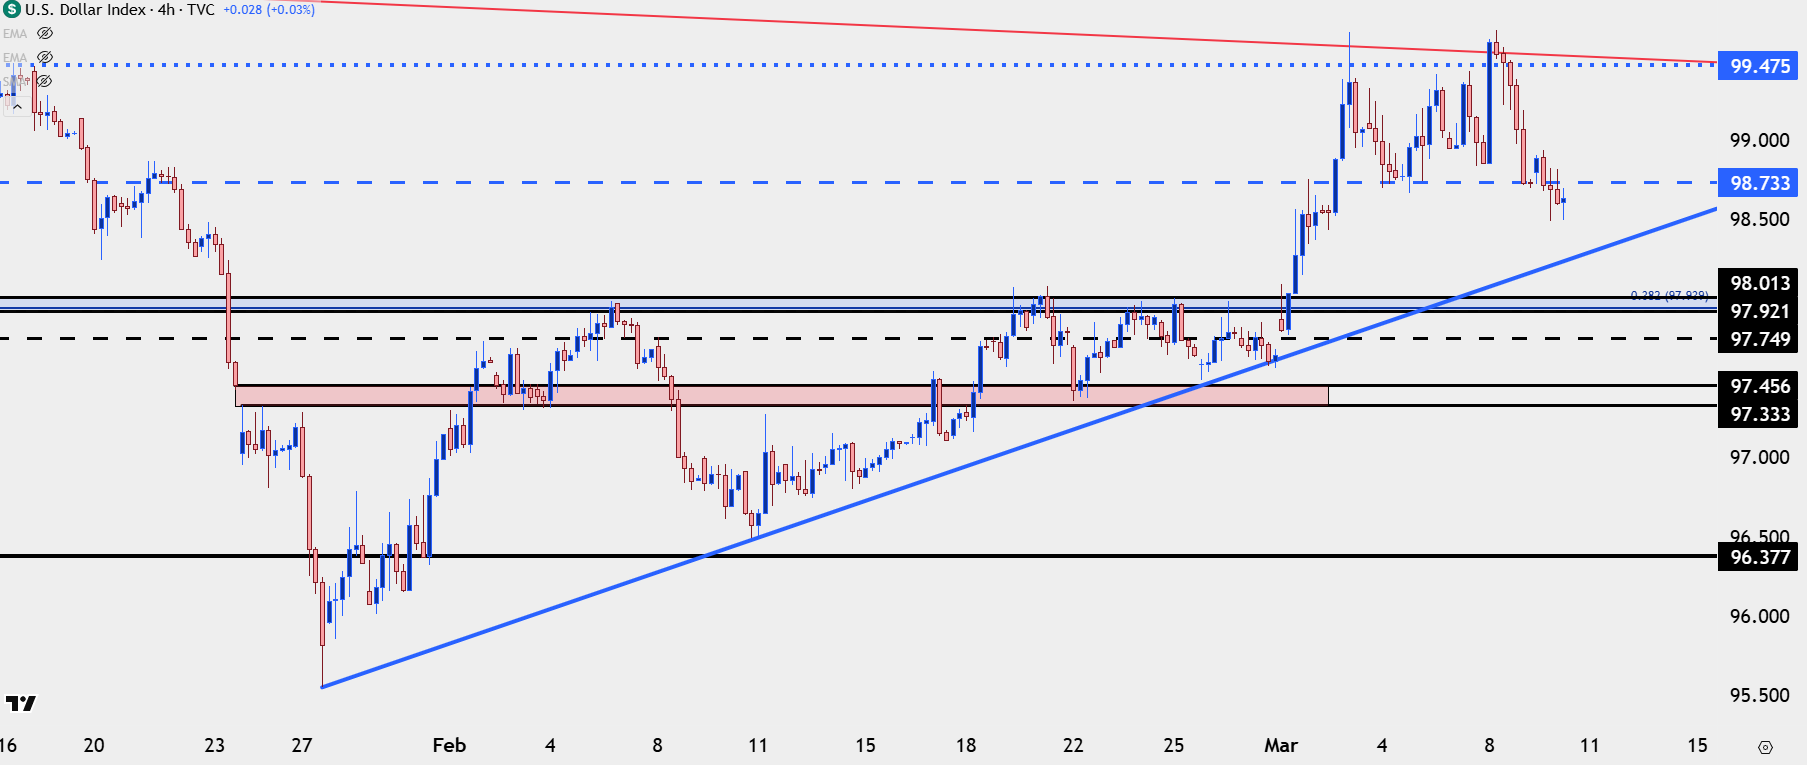
Chart prepared by James Stanley; data derived from Tradingview
EUR/USD
The Euro has shown mirror image-like dynamics from the USD setup above, with five consecutive days of underside wicks highlighting a failure from sellers to run with the open door to a breakdown.
Like I said on the USD back in January when the currency was oversold – the true test is what happens when bears have a hit of lower-high resistance, and for EUR/USD, there’s a few levels of note just overhead at 1.1686 and 1.1748.
Shorter-term, I think there’s an open door for a push of the near-term trend up to those levels and the CPI release tomorrow is an opportune area to see how sellers respond.
Now, if bears show up at either price and then that leads into a higher-low, such as we saw in USD in February, then bigger picture reversal themes can grow attractive again.
EUR/USD Daily Chart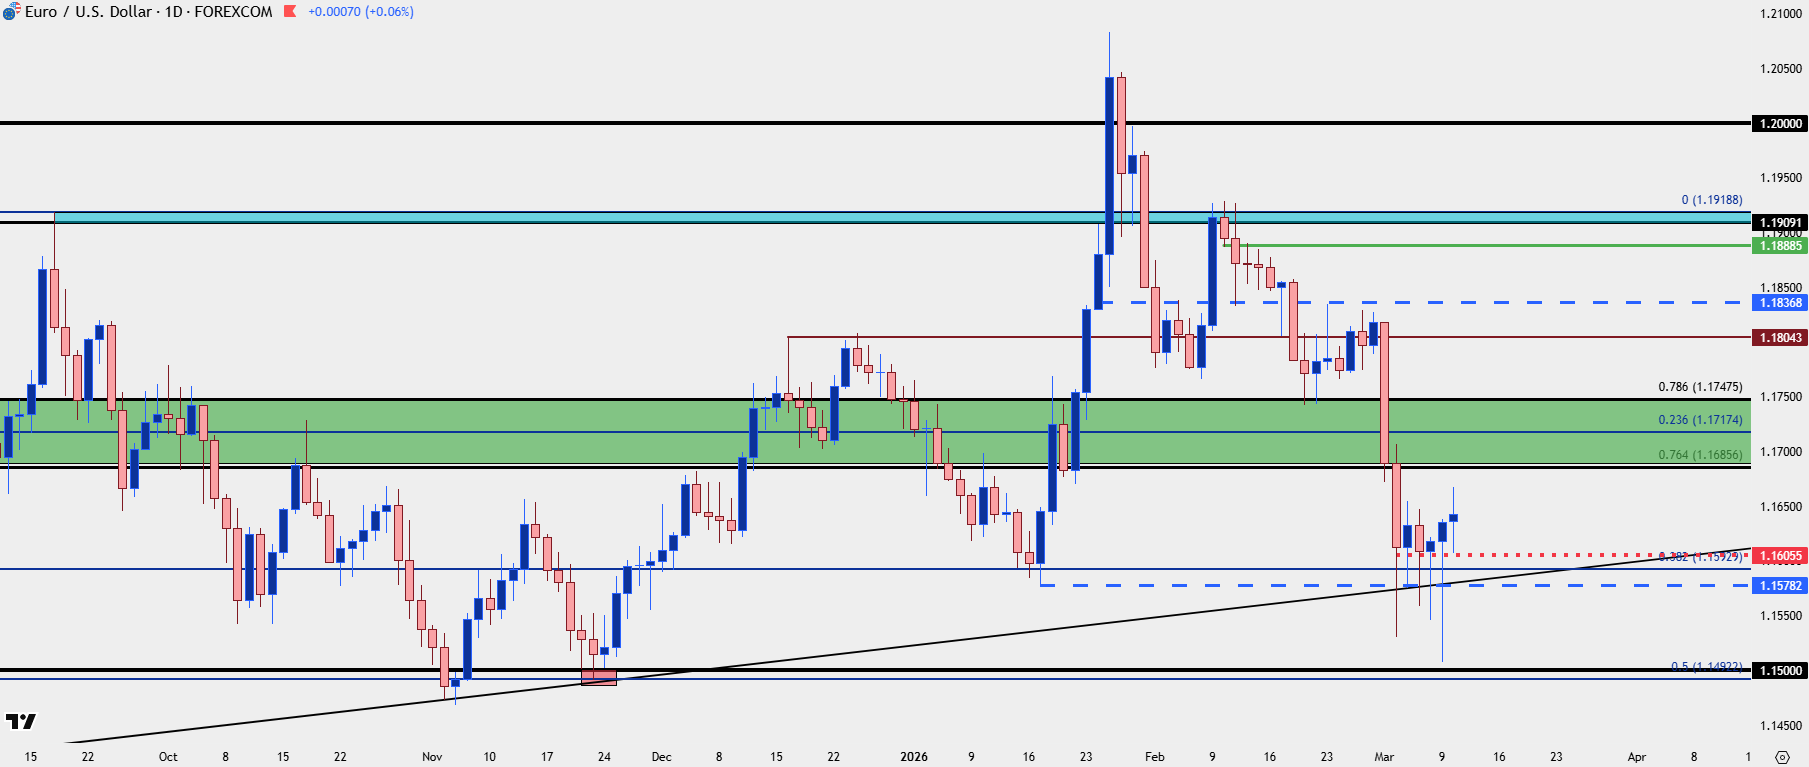
Chart prepared by James Stanley; data derived from Tradingview
GBP/USD
Structurally GBP/USD looks a bit more attractive to me for USD-weakness themes and the pair has already pushed above the 1.3414-1.3434 resistance zone that I had looked at last week.
With that said, a big test awaits at the 1.3500 handle and above that, it’s the 1.3568 level that held the last lower-high before the breakdown move. If price can push up for a revisit of that latter level, I like the possibility of breakout especially as compared to the EUR/USD setup above which I would anticipate would be a test around that 1.1748 level (prior support before the breakdown).
GBP/USD Four-Hour Price Chart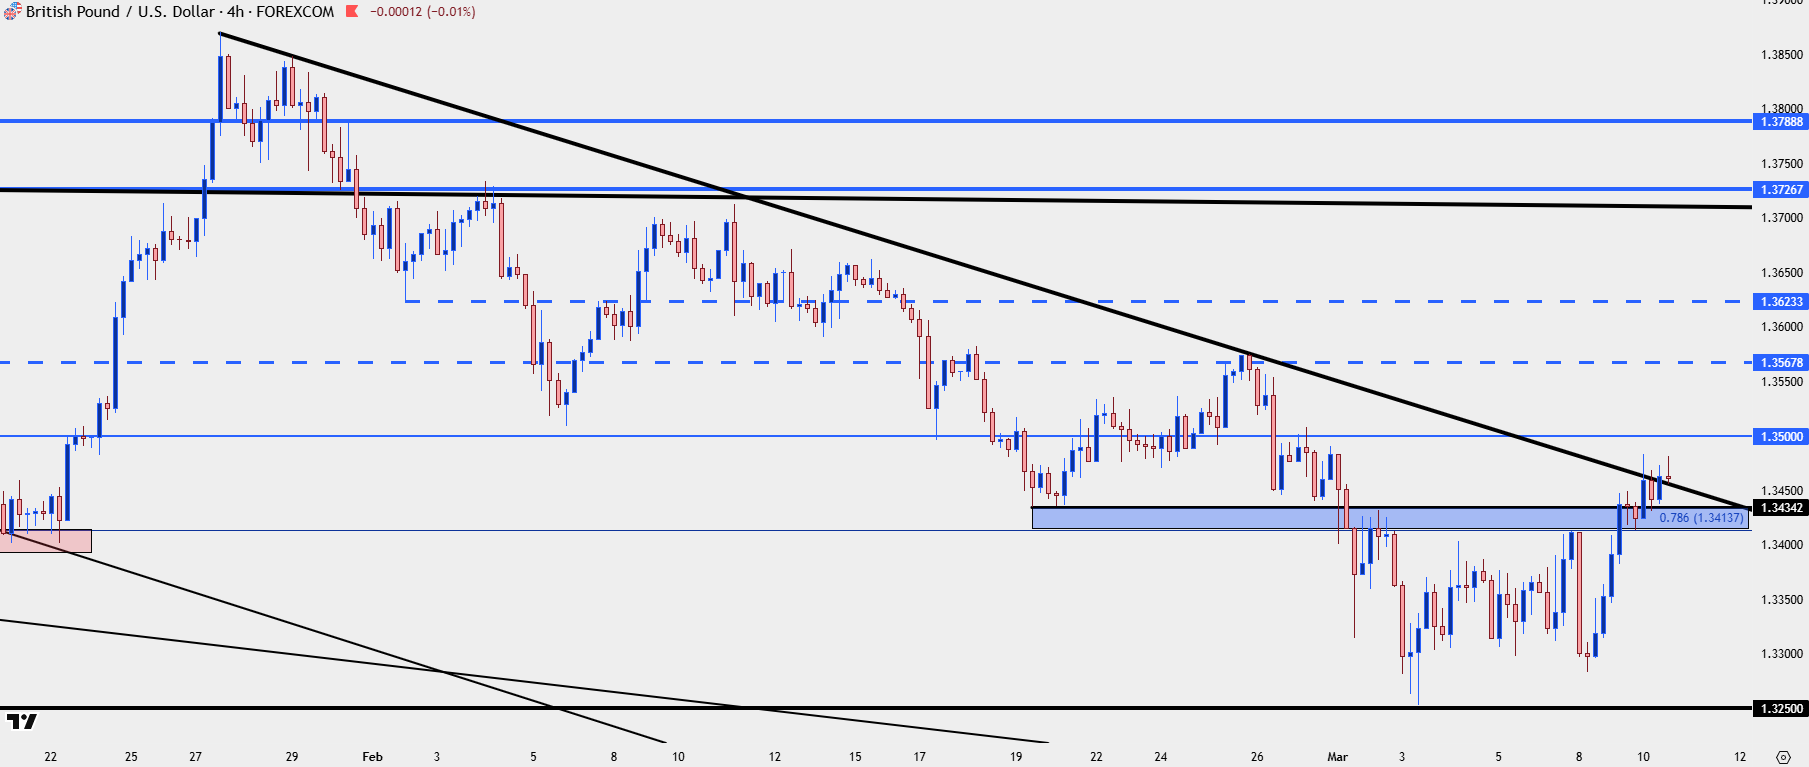
Chart prepared by James Stanley; data derived from Tradingview
USD/JPY
If there is going to be a big breakdown in the USD it seems that it would need some help from what’s been an unlikely participant in such scenarios over the past 11 months with the Japanese Yen. As the pair gets closer to the 160.00 level that was defended vigorously in 2024 and traders haven’t wanted to test since, this would very much be a counter-trend type of theme.
But – remember back to just late-January when a strong sell-off drove fears of intervention, and then it was the move in early-February that actually had more of an intervention-like feel to it.
It seems that both the US and Japan would like to see a lower spot rate for the pair, although not quite below the 152.50 level which has functionally helped to provide support twice since that late-January sell-off.
And, notably, it was around CPI releases that we saw some massive moves in the pair as the July 11th 2024 iteration saw the BoJ intervene on the morning of a CPI announcement which drove a dizzying reversal in the pair.
With that said, structure is bullish for now given the continued higher-highs and higher-lows and I think there are more attractive venues for USD-weakness at this point, such as the EUR/USD or GBP/USD setup looked at above.
From the USD/JPY daily chart, yesterday’s bar finished as a shooting star, often followed for bearish reversal potential. There’s a spot of support potential from prior resistance around 156.76, but if that gets taken out, the door is open for a run down to 155.54 and then the 154.45-155.00 zone lurks below that. If bulls lose that latter zone matters in USD can develop quickly as I’d anticipate that would go along with a EUR/USD break above 1.1800.
USD/JPY Daily Chart
Chart prepared by James Stanley; data derived from Tradingview
Crude Oil
Since oil has so much pull on the current macro backdrop I wanted to include a chart here. Just as quickly as it broke out sellers have been draining the move, with another lower-low printing today.
The move was in its early stages when I wrote about it in yesterday’s article but this continuation highlights the build of bearish short-term structure that puts more emphasis on the 91.27-91.63 zone, and at current we’re seeing a bounce from the 80-handle which is confluent with a key Fibonacci level, the 61.8% retracement of the same move that caught the high at the 161.8% marker.
Underneath price, it’s the gap from the March open, when the Iran war initially began to get priced in and that sits from 67.29-69.20.
WTI Crude Oil Futures Four-Hour Chart
Chart prepared by James Stanley; data derived from Tradingview
--- written by James Stanley, Senior Market Analyst, Global Macro