
US Dollar Talking Points:
- A hawkish rate hike has helped to push USD-strength, but the bigger matter at hand for FX markets is USD/JPY, where a crowded carry trade remains in place.
- Dual intervention can be enough to force pullbacks but for a larger reversal in the USD/JPY theme there will likely need to be a bigger shift in fundamental dynamics. And in that scenario, like we saw in July of 2024, there could be a larger issue across macro markets with a de-leveraging event.
The US Dollar has rallied since last Wednesday’s rate hike and DXY is now testing above the 100.00 level, with resistance showing at a familiar spot of 100.64. As has been the case, USD/JPY remains a big driver of USD pairs but the prospect of reversal there seem distant. The fundamental bias remains tilted to the long side of the pair and until USD/JPY pushes up to test fresh highs, there seems little motivation for policymakers to risk wasting precious dry powder.
That said, pairs like EUR/USD and GBP/USD appear to be along for the ride, with each testing fresh lower-lows and nearing oversold territory on the daily via RSI.
In the DXY basket, the year-plus range remains in-place, and short-term support exists at that 100-100.22 zone followed by 99.69.
US Dollar Weekly Price Chart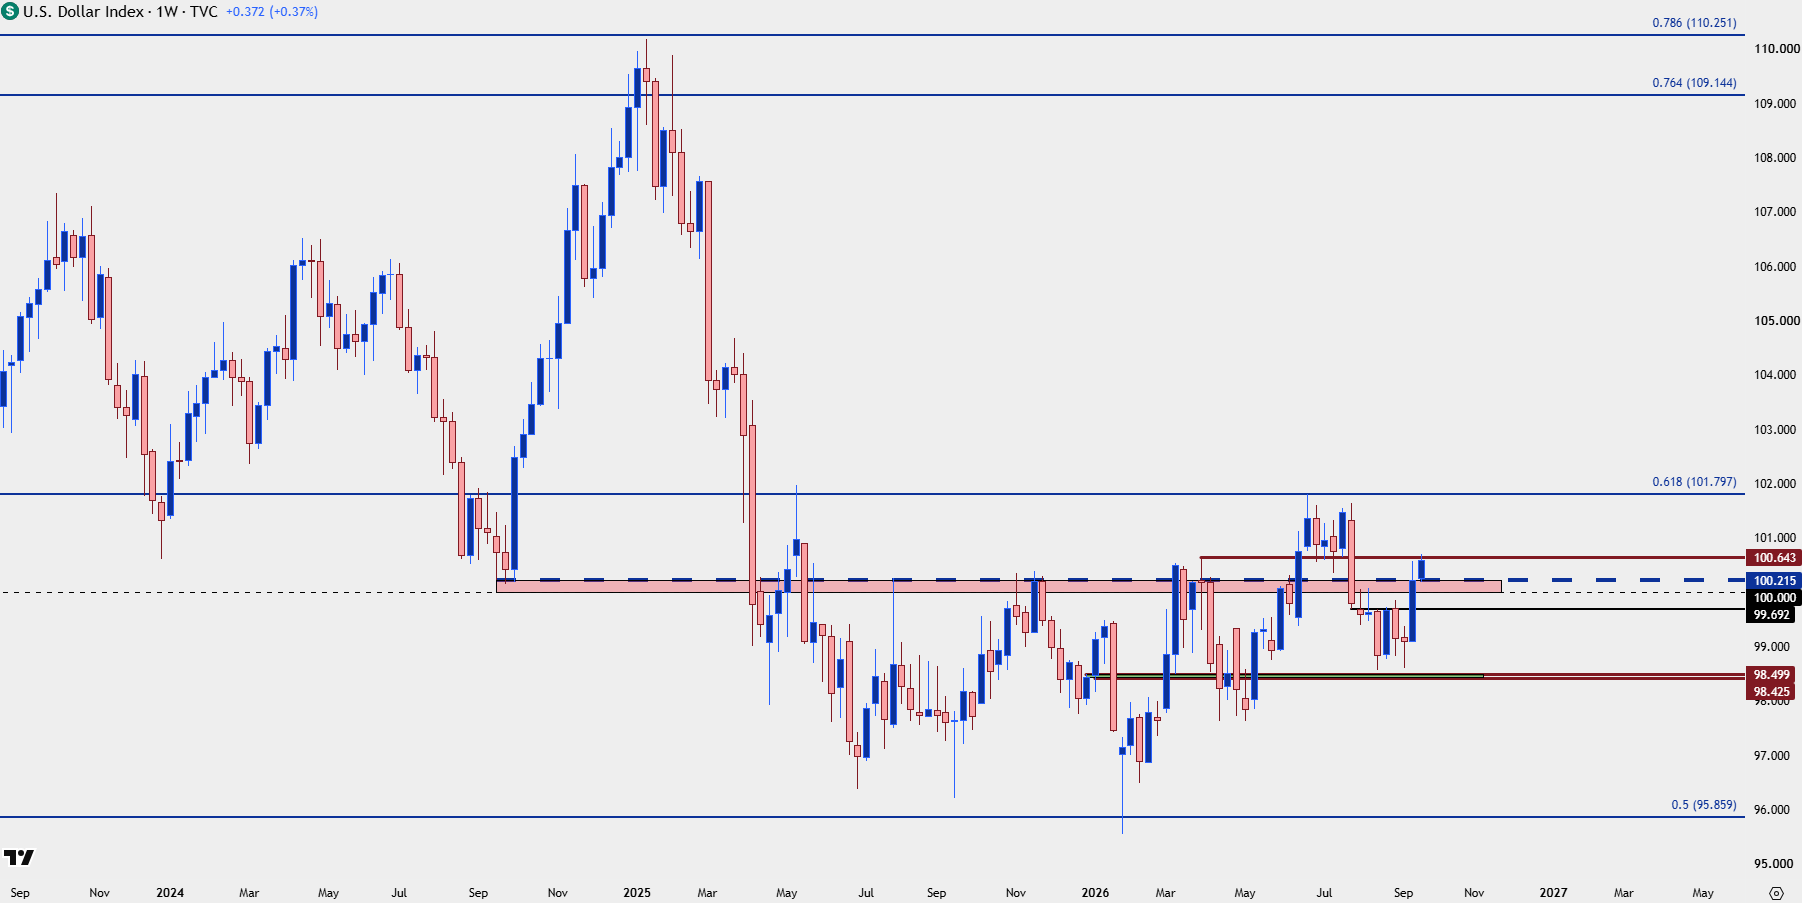
Chart prepared by James Stanley; data derived from Tradingview
USD/JPY

The five-year trendline held the lows over the past two weeks and now bulls are making a push of short-term strength. I discussed this in the article yesterday, contrasting the bearish longer-term backdrop with the bullish shorter-term look.
It remains very much a tug-of-war and if we do see another push up towards the 160.00 level, I wouldn’t be surprised to hear another volley of intervention threats from the US or Japan or perhaps even both sides.
USD/JPY Weekly Chart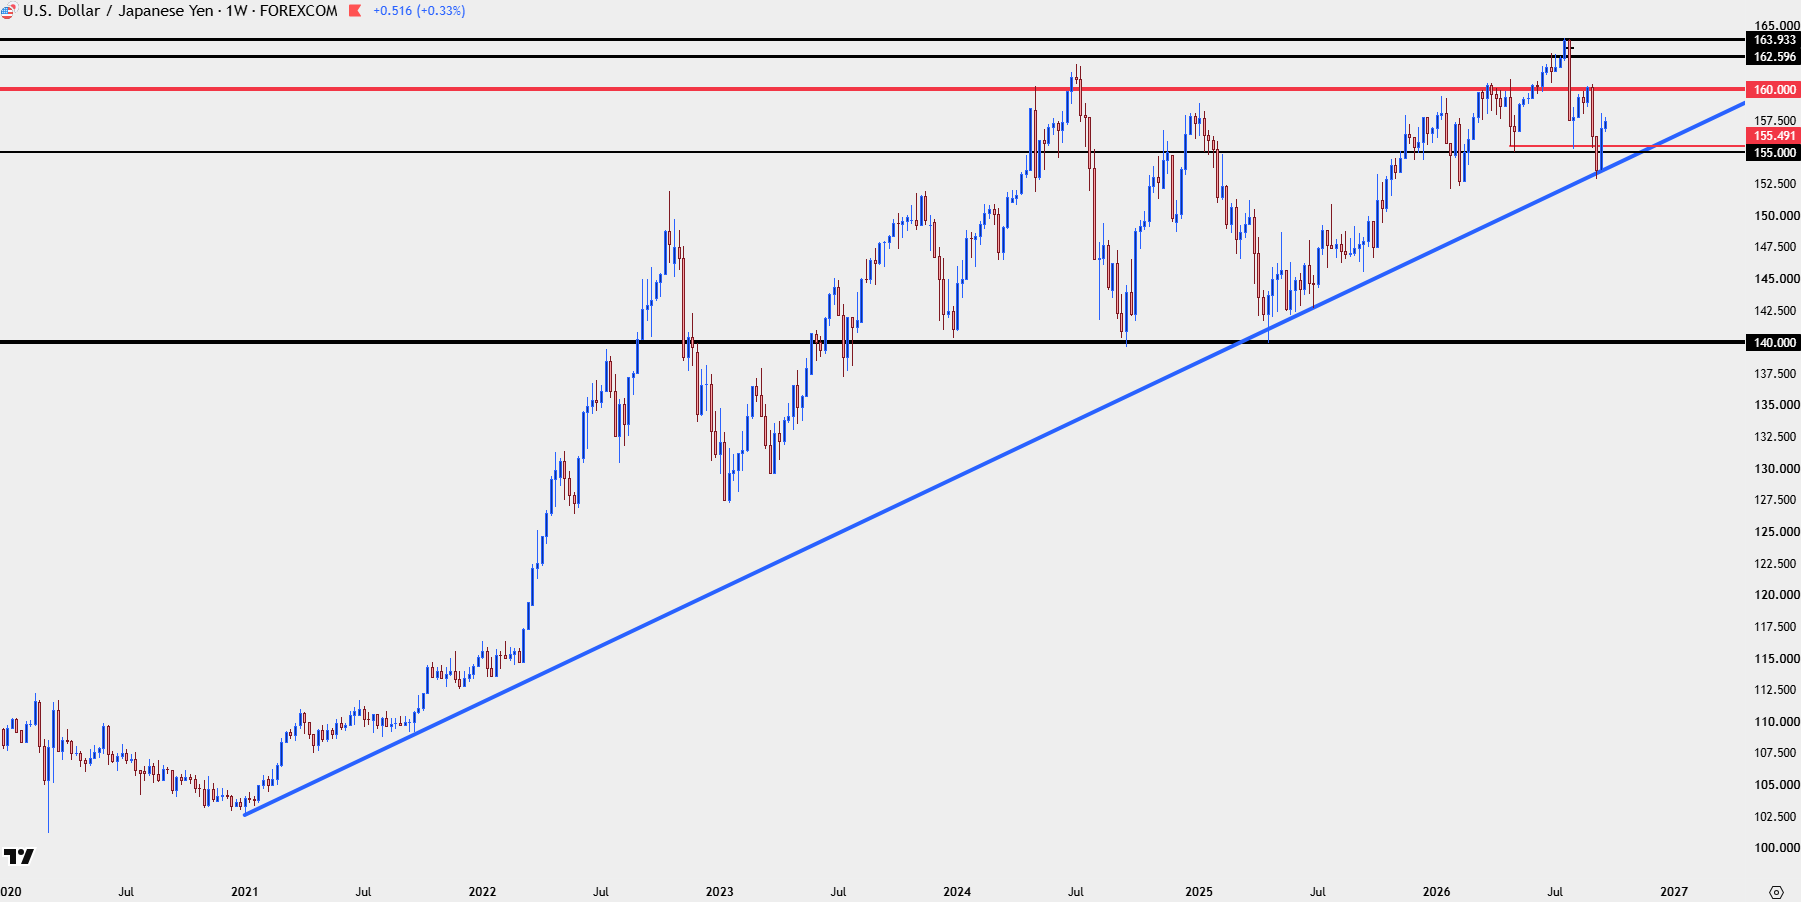
Chart prepared by James Stanley; data derived from Tradingview
EUR/USD
It’s been a very rangy past year-plus in EUR/USD, as well, and as such, RSI has offered some stellar insights of late. Of course, a lagging indicator of this nature will always bring a degree of question but with the pair moving quickly towards oversold conditions, there may be an opening backdrop for a pullback or possibly even a reversal set up in the not-too-distant future.
EUR/USD Daily Price Chart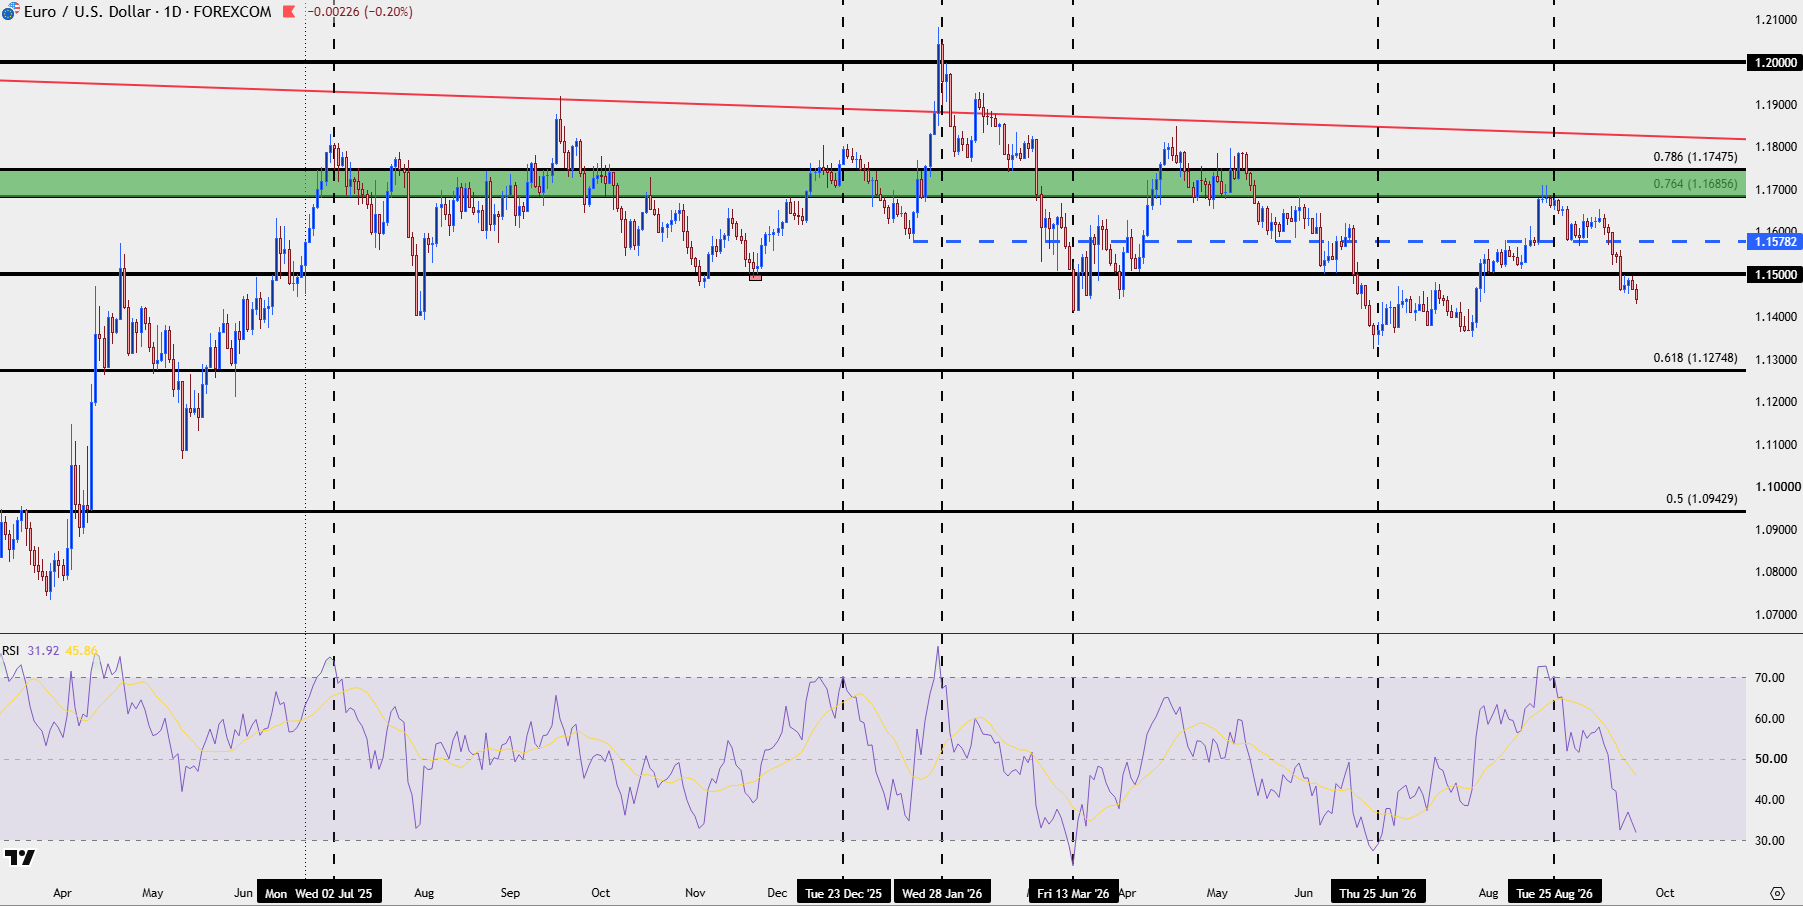
Chart prepared by James Stanley; data derived from Tradingview
GBP/USD
Similar setup in Cable, where the pair is nearing oversold on the daily while testing a familiar spot of support/resistance at 1.3325. This is a pair I would have a challenge trying to sell at the moment, unless there’s a larger pullback to work with that can be justified as a lower-high.
GBP/USD Four-Hour Chart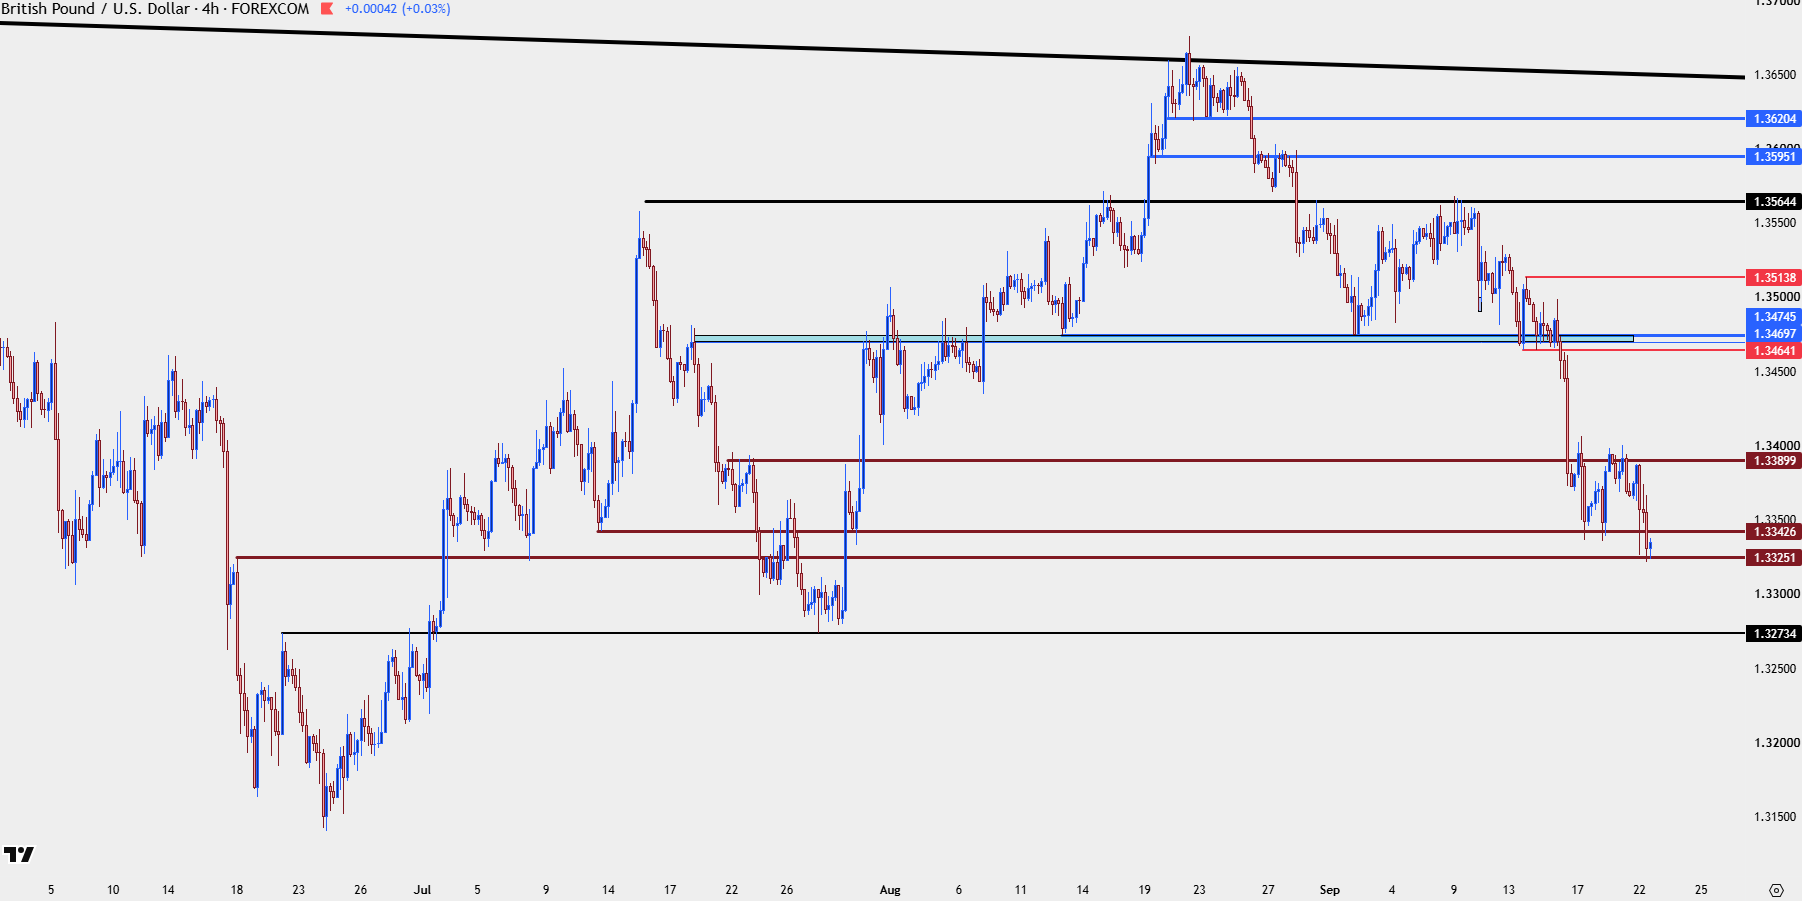
Chart prepared by James Stanley; data derived from Tradingview
USD/CAD
USD/CAD has been my pick on the long side of the Dollar for some time now, and the pair has just rammed through the 1.4000 level with only a brief pause. That round number now becomes higher-low support potential with 1.3967 just below that.
USD/CAD Daily Price Chart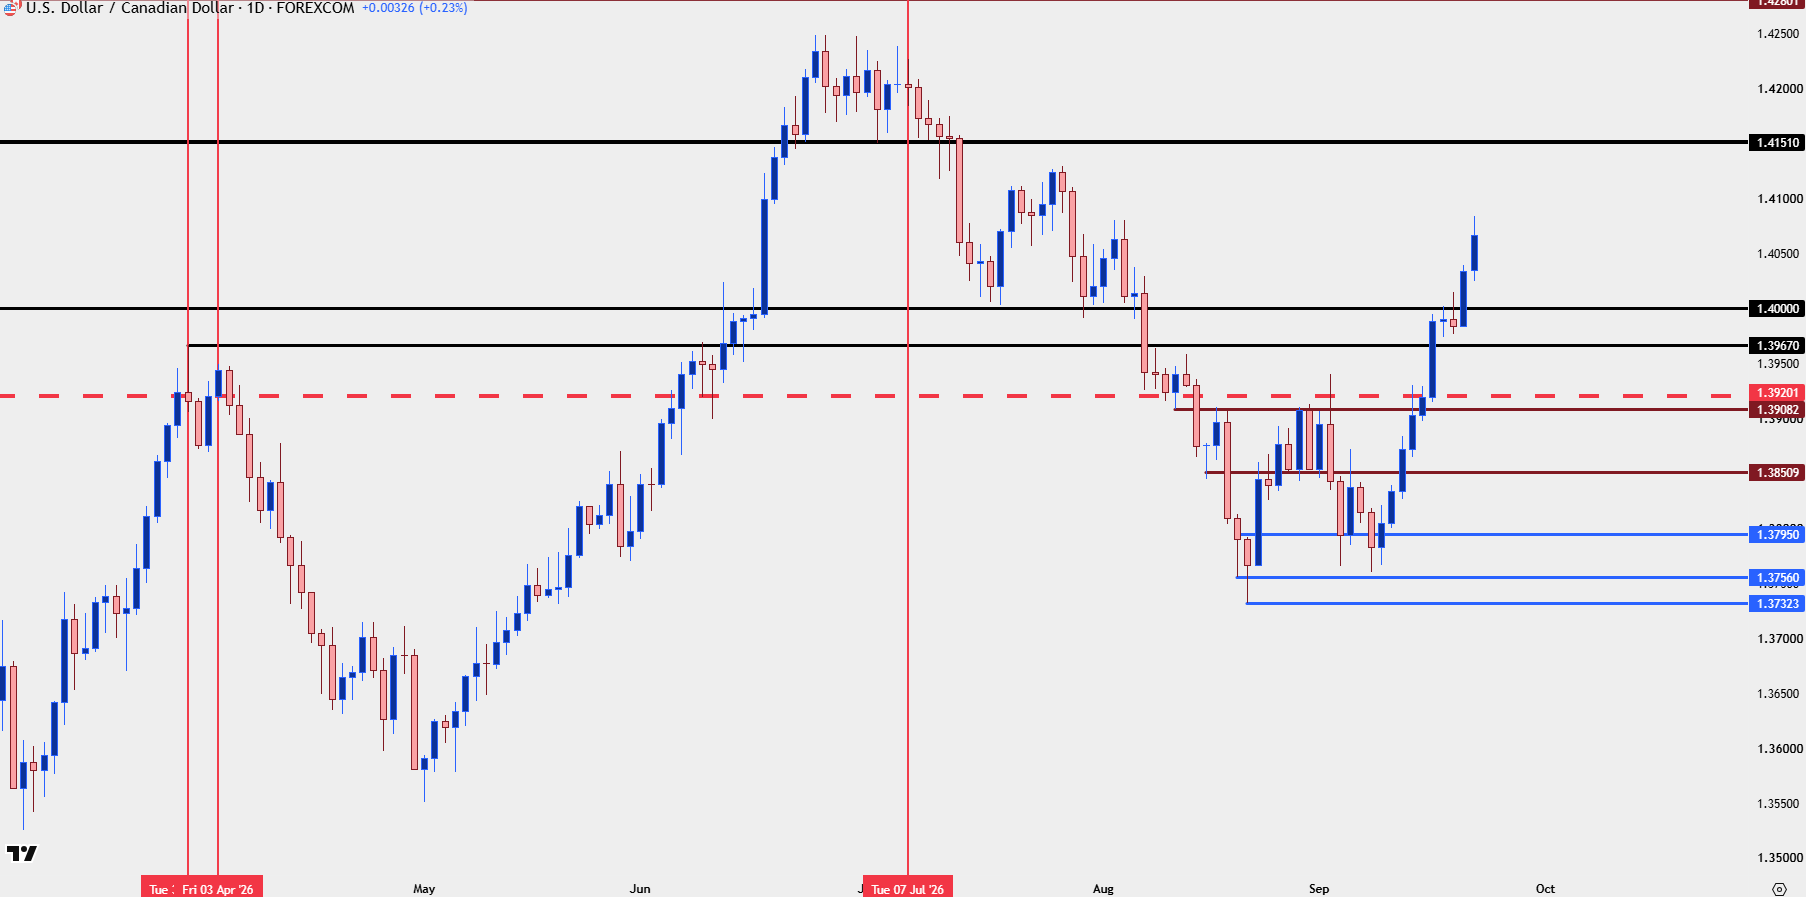
Chart prepared by James Stanley; data derived from Tradingview
Gold
At the time of the webinar gold was testing a big spot of support, and as I shared then, this is what could set up for a higher-low. That spans from 4300-4320 and it sits above last week’s FOMC-fueled swing low of 4235.
That setup remains of interest, although Bitcoin has put in a larger move of strength to take attention away as an anti-fiat vehicle.
Gold (XAU/USD) Daily Chart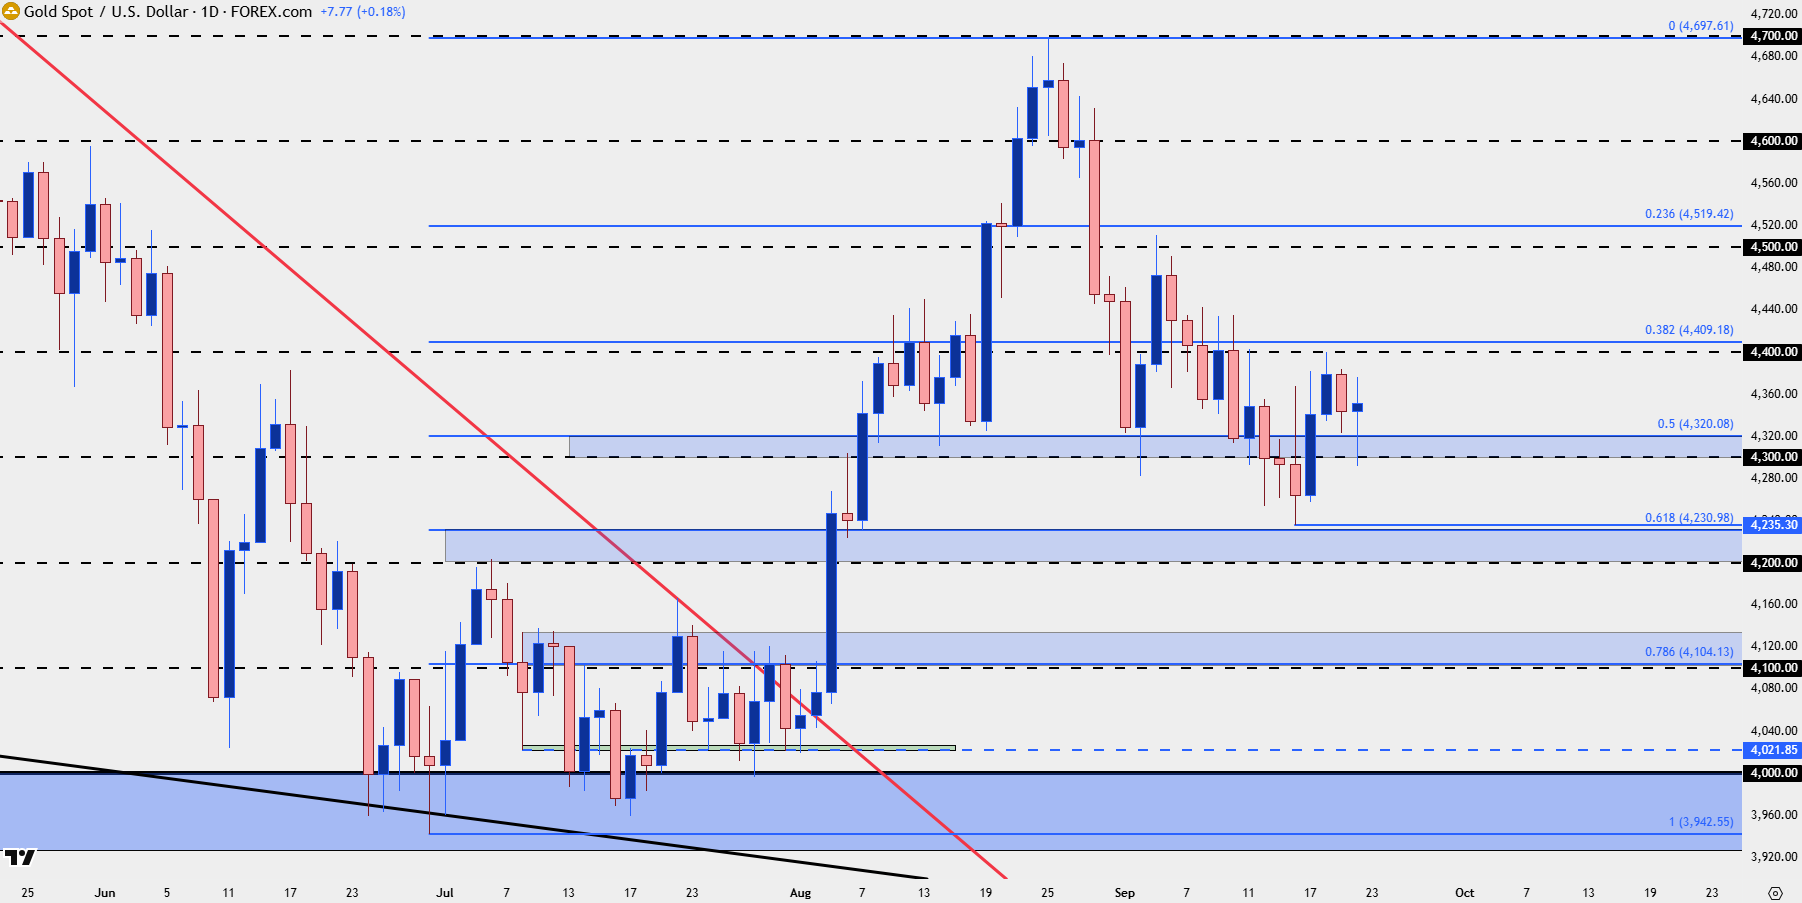
Chart prepared by James Stanley; data derived from Tradingview
--- written by James Stanley, Senior Market Analyst, Global Macro