


Key Events
- As thousands of protesters take to the streets of Iran, US-Iran tensions rise, lifting crude prices back toward the $60 barrier on supply disruption risks from OPEC’s fourth-largest producer.
- While politics label it regime-change business, crude markets price it as bullish hedging risk, overshadowing 2026 oversupply concerns.
- From sanctions to potential supply disruptions, could reform add further pressure on global crude supply?
Following Maduro’s fall earlier this year, Trump’s regime-change focus has shifted toward Iran, where thousands are marching in the streets, raising the risk of regional escalation and potential crude supply disruptions. Iran remains OPEC’s fourth-largest oil producer, and while a positive reform combined with eased sanctions could allow additional supply to return to the market, a non-peaceful transition would likely trigger retaliatory risks across the region, increasing crude supply uncertainty.
Earlier tensions between the US and Venezuela initially supported crude prices, before sanctions were lifted and higher oil flows to the US added renewed bearish pressure. A similar outcome appears far less likely with Iran, given its scale of influence and its far-reaching impact on global energy markets.
With multiple geopolitical risks now in play—spanning Venezuela and its allies, renewed tensions involving Greenland and its partners, and escalating pressure on Iran’s Islamic regime—risk appetite remains muted. At the same time, upside hedging risks are emerging in crude markets. CME crude oil options data shows call option volumes significantly exceeding put volumes, signaling increased demand for upside protection, particularly across contracts expiring between February and March 2026.

Source: CME
Technical Analysis: Quantifying Uncertainties WTI and Brent Charts
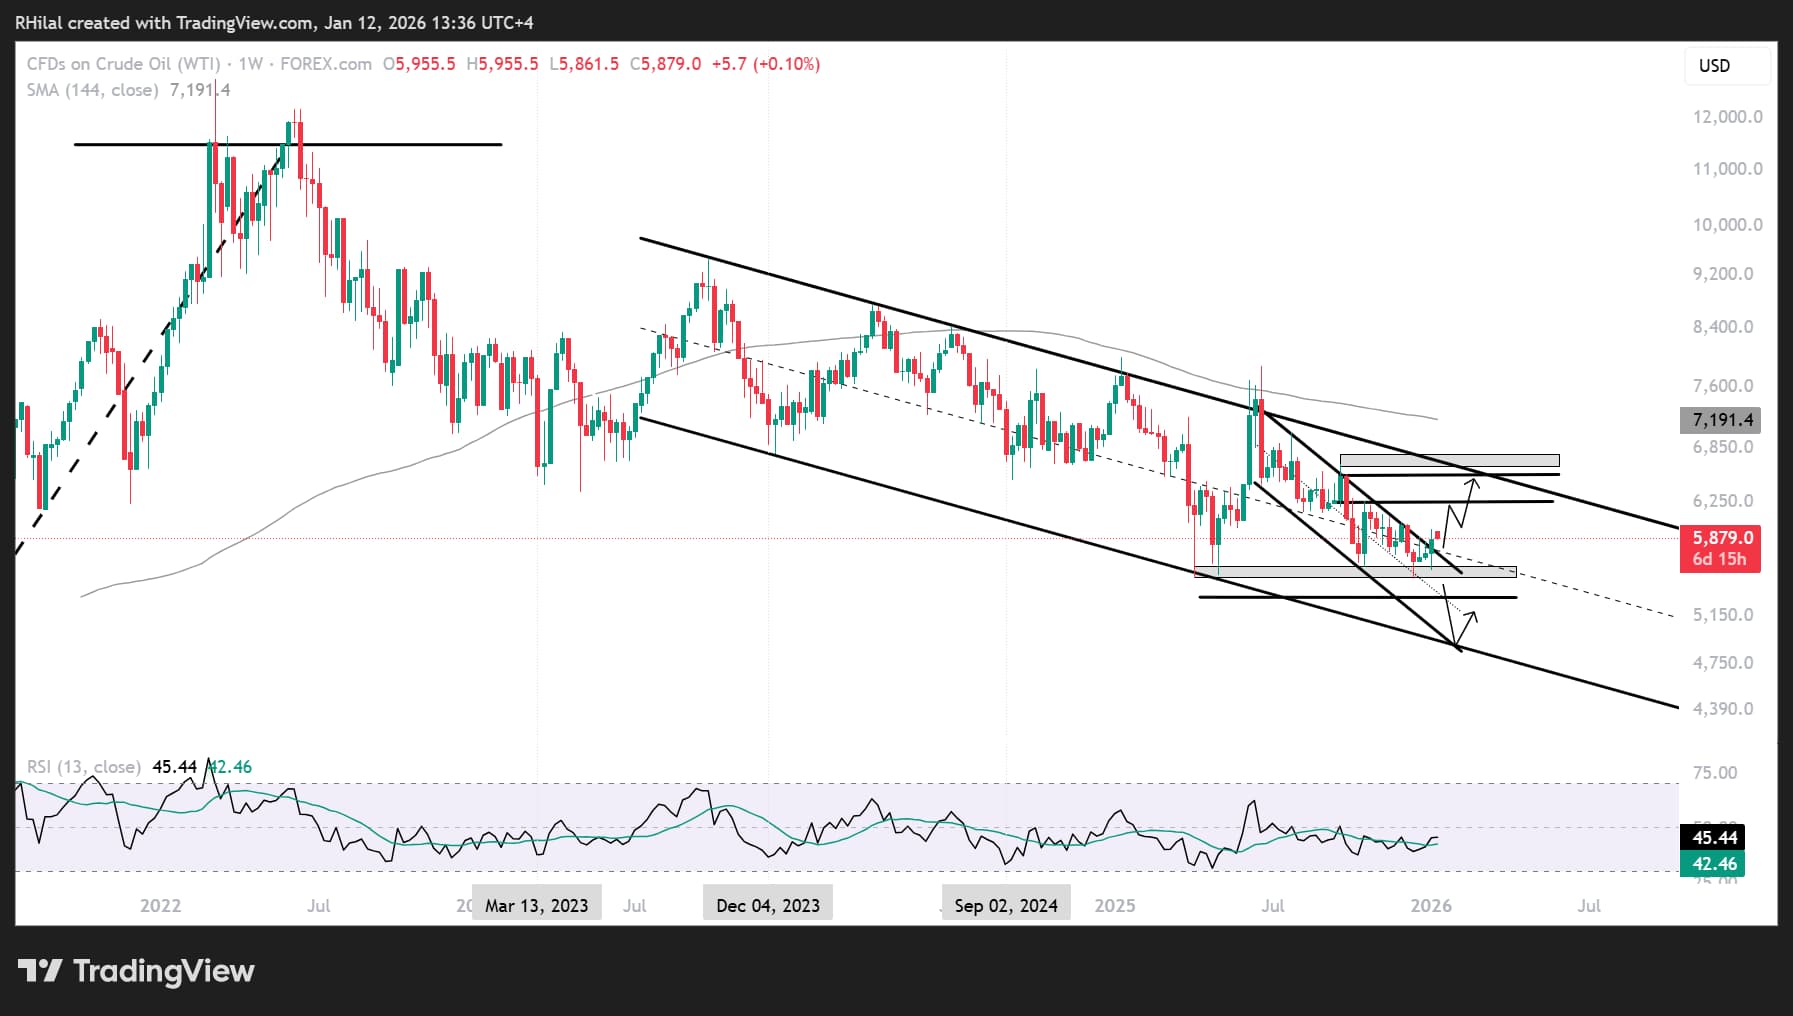
Crude Oil Outlook: Weekly Time Frame – Log Scale
Source: Trading view
While crude prices are trading above the bearish channel since June 2025, and above the mid-zone of the down-trending channel in place since September 2023, the $60 level remains a key psychological barrier. A sustained break above it could revive bullish momentum toward $63, $65, and $68, before confirming a longer-term bullish breakout.
From the downside, a reversal back below $57 and $55 would expose a steeper decline, aligning with the lower boundary of the channel connecting the December 2023 and April 2025 lows near $49, presenting a potential buy-the-dip opportunity back toward breakeven levels.
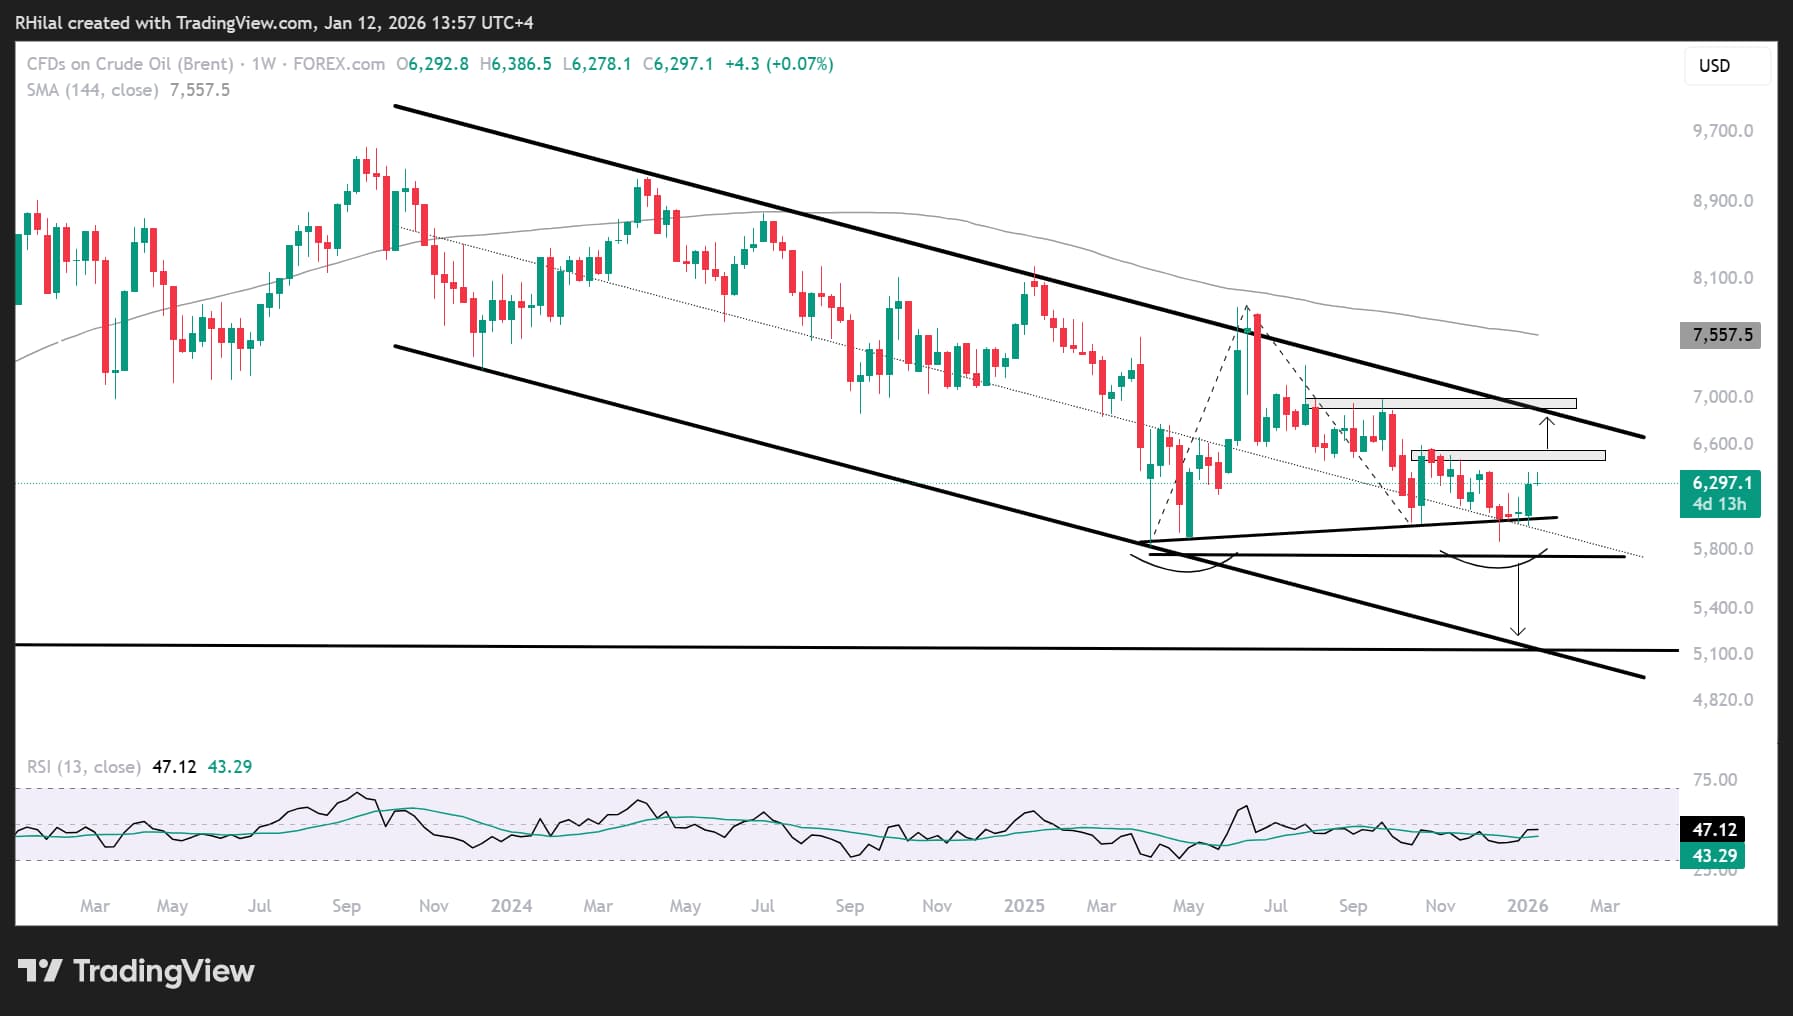
Brent Outlook: Weekly Time Frame – Log Scale
Source: Trading view
In line with US crude, Brent is holding above the mid-zone of its respected down-trending channel since December 2023 and above the $58 support and 2025 lows. A clean break below the $58 level would likely extend the decline toward the lower boundary of the channel near $49.
From the upside, $65 and $70 remain key resistance levels before confirming a long-term bullish breakout beyond the dominance of the two-year down-trending channel.
Written by Razan Hilal, CMT
Follow on X: @Rh_waves






