
For the past six months I’ve retained a bullish lean in USD/CAD but given the past month but more precisely the support reactions over the past week, that stance must come into question. After all, one of the largest benefits of price action is its objectivity and if we’re seeing bulls fail to defend higher-lows and we’re seeing bears push below major psychological levels in a way that they weren’t just a couple of weeks ago, we have to acknowledge that the prospect of change is in the picture.

To start, I want to look at the monthly chart of the pair as USD/CAD has been in a range for the past decade. This was a big part of my thesis earlier in the year, when USD/CAD was breaking-higher and threatening a 1.4500 test. That price ultimately helped to set the high in early-February and that was just before the broad-based breakdown in the USD.
As sellers attacked the US Dollar in March and April, USD/CAD led the way lower, and that move largely remained strong through May and into June. But it was the 1.3500 handle that sellers ultimately couldn’t test or take out, and that led to the build of a bullish formation in June that took hold in July.
USD/CAD Monthly Price Chart
Chart prepared by James Stanley; data derived from Tradingview
From the above monthly chart, we can see that if the longer-term range is to continue filling in there could be considerable room for bears to push-lower. This would likely need to come along with a larger breakdown in the USD and while that’s been a tenuous theme over the past few months, more evidence of weakness in the US economy, similar to what showed earlier this year when USD/CAD initially broke below 1.4000, could certainly further that push.
Time frames matter, however, as this is both what helped to show the breakout setup coming into February as well as the reversal push in June and July.
Sellers came on so quickly in April and May that the pair had one sided positioning that made a breach of the 1.3500 handle a difficult prospect. There was a clean hold of resistance at prior support of 1.3750, but each hit at the level brought a higher-low and that built an ascending triangle, which is a bullish breakout formation.
That bullish breakout hit in July with some help from the FOMC; but perhaps the more notable factor is what happened after. The NFP report on August 1st led to a hurried sell-off in the USD and DXY eventually dropped to fresh lows. USD/CAD, however, held that same 1.3750 level of prior resistance as fresh support. That continued the pattern of higher-lows and as USD-strength showed after the FOMC rate cut in September, USD/CAD drove-higher.
This was one of the more attractive long-USD setups as that bullish structure highlighted the addition of CAD-weakness. The pair soon put in a strong break of the 1.4000 level and then, eventually, stalled just ten pips inside of a zone of resistance-turned-support at 1.4151. This was a zone I looked at as top-end resistance before the breakout had hit months earlier; but now the objective look is that bulls continually failed to push through that zone and have since given way to sellers driving a deeper pullback and a run back-below 1.4000.
USD/CAD Weekly Chart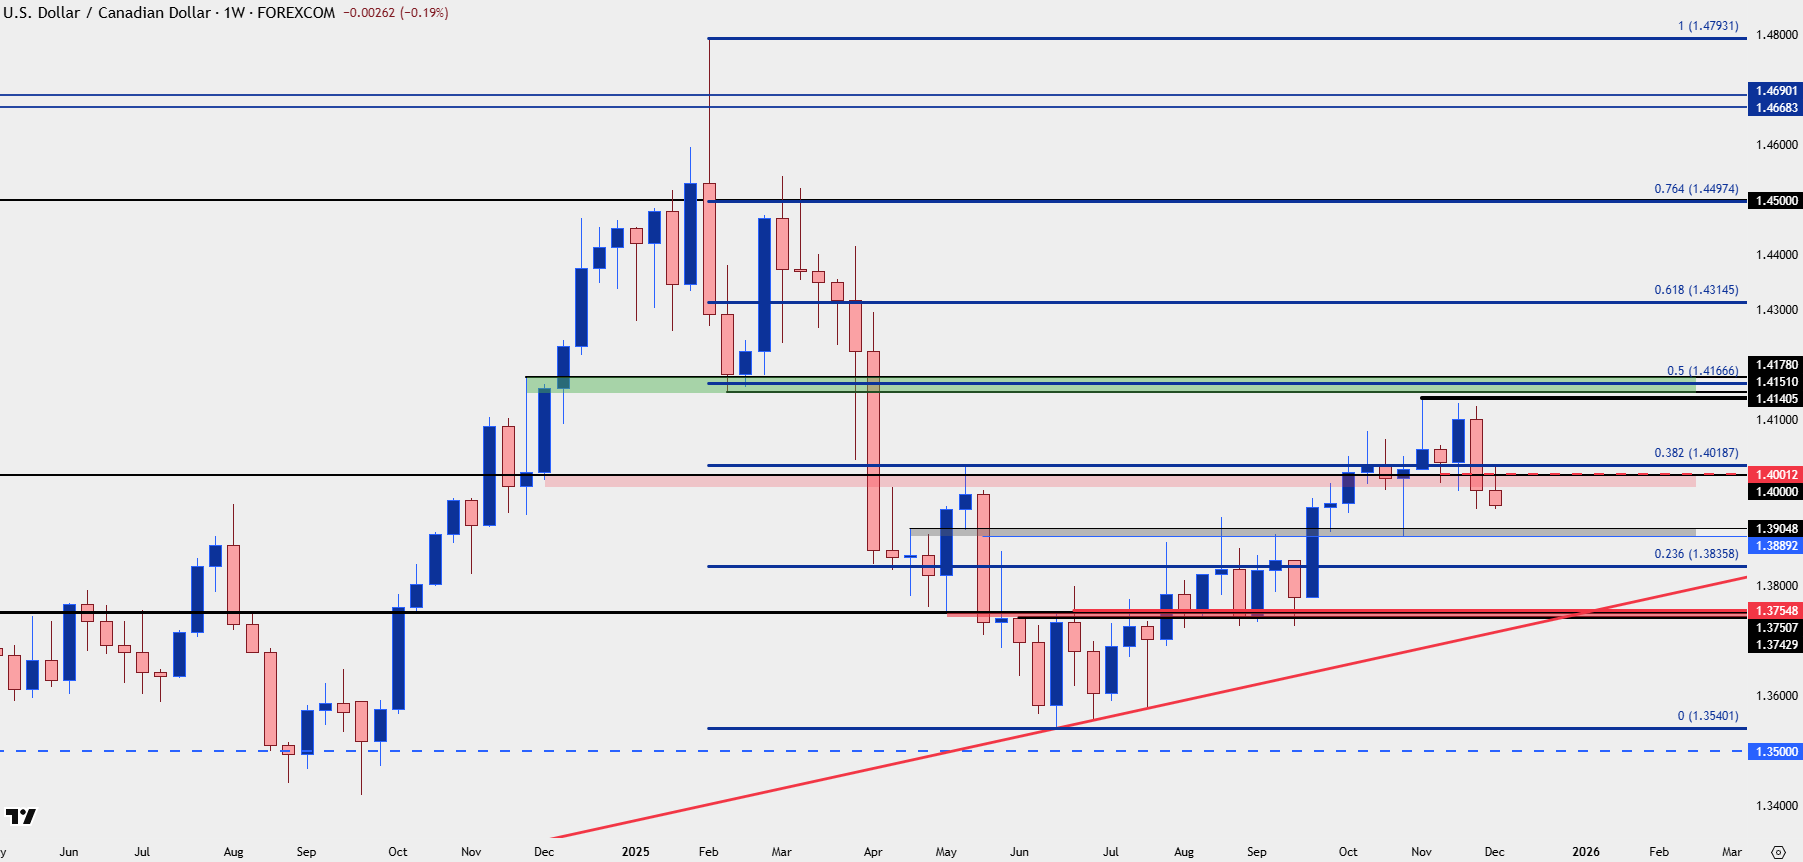
Chart prepared by James Stanley; data derived from Tradingview
USD/CAD Bulls Letting it Slip
At this stage the bearish move is still rather recent and frankly somewhat tenuous. We have the lower-high hold with failure to push through 1.4151 but the more recent item is the 1.4000 resistance hold yesterday.
That says that the pair pushed above 1.4000 but sellers used the opportunity to fade the pullback, which is in stark contrast to just a couple of weeks ago when the push below 1.4000 brought bulls into the mix to prod a rally. This shows that we could be on the verge of a larger sell-off, and this opens the door for a re-test of the 1.3900 area that held the lows at the October FOMC meeting.
So far this morning, however, there’s been a stall at last week’s low so there’s a couple of different ways to approach the matter if looking on the short side of the pair. The stalling can be respected, and traders can then look for a pullback to a lower-high. The 1.3980 level stands out, and a 1.4000 re-test could even be looked to as a lower-high provided that bears keep the swing inside of yesterday’s high, thereby keeping the lower-low/lower-high short-term structure intact.
Alternatively, breakout strategies can be used looking for breaches of the low to make a push towards the 1.3900 zone, which I’m tracking from 1.3889-1.3905.
USD/CAD Daily Chart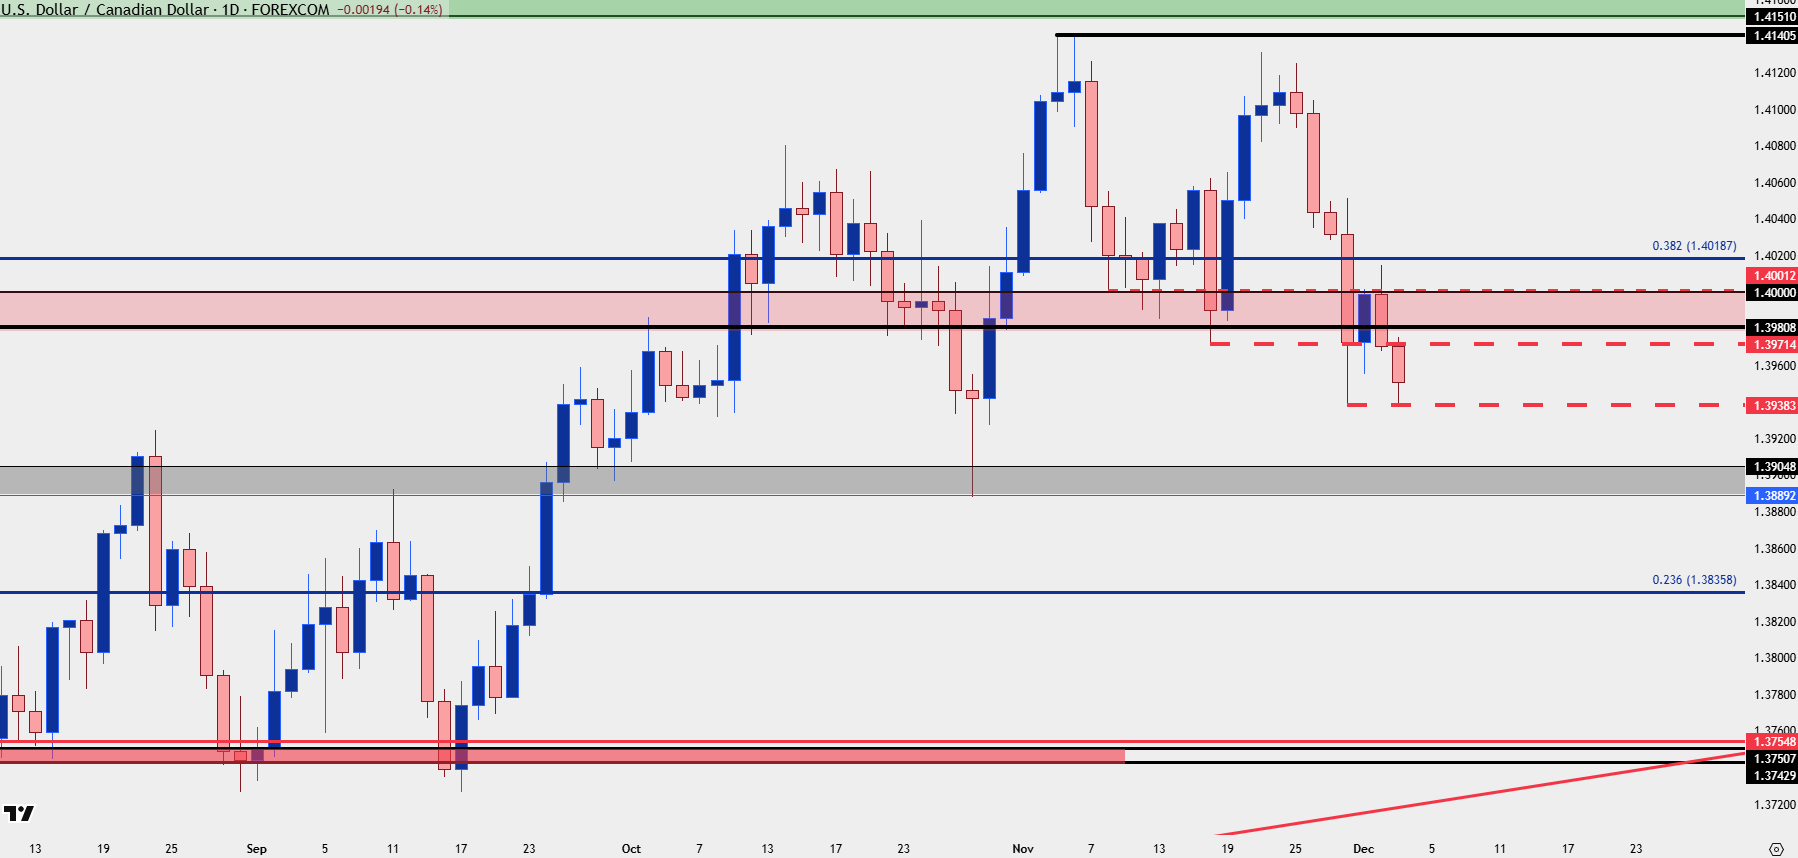
Chart prepared by James Stanley; data derived from Tradingview
--- written by James Stanley, Senior Market Analyst, Global Macro