
Japanese Yen, USD/JPY Talking Points:
- It’s rare to see a Treasury Secretary so vocal about a currency value, but it’s become obvious that Scott Bessent does not want USD/JPY to rise significantly, and there’s likely multiple reasons behind that.
- While one person’s opinion may not be enough to reverse the interest rate dynamics in two of the world’s largest economies, it could produce a challenge for near-term price action, as a theoretical cap to price could create a compelling reason for longs to bail on positions, particularly if US data worsens in the weeks ahead.
- In this article, I want to draw attention to a similar situation in Q4 of 2022, when BoJ intervention stalled a rally for about a month, until US data started to dim and that drove longs to quickly close positions, resulting in a 50% retracement of the prior trend.
Merely for a point of reference, it’s uncomfortable how much of the crowd seems to remain bullish in USD/JPY. This is anecdotal, of course, and observational so somewhat subjective, but putting all the pieces together seem to make the risk-reward potential in USD/JPY look askew to the upside.
At this point we’ve had loud proclamations from both the US side and the Japanese side on the matter, as both economies do not want to see USD/JPY appreciation. And while markets have often run against Japanese intervention, given the multiple episodes that we’ve seen particularly over the past five years, the history of coordinated intervention from both economies is far more sparse but significantly clearer.
I think it’s rather obvious why both the US and Japan would prefer if USD/JPY does not appreciate to another fresh 40-year high. For Japan, this invites inflationary potential and for the US, this would entail a stronger US Dollar which would be a hindrance for trade and capital flows given that the Yen is a 13.6% component of the DXY basket. I think, ideally, both economies would like to see a bit of stability in the exchange rate but that’s not something that market participants always welcome.
For this article, I wanted to draw a parallel to Q4 of 2022, when a similar scenario had set up before us. At that point, the US had just posed a series of blistering rate hikes while Japan rates stayed flat, thereby setting up the divergence that remains in place today. But, as we often look at in webinars, fundamentals aren’t a perfect push point for price as the only thing that actually impacts price action is buying and selling. And when a trade is increasingly crowded and even the slightest hint or whiff of change is on the horizon, prices can reverse quickly – even against the fundamental bias that should otherwise drive the market.
But when the BoJ intervened in October of 2022, it was to defend the 150.00 level in the USD/JPY pair. The actual high printed at 151.95 and it was a worrying scenario, as the Yen was in meltdown mode. The BoJ stepped in and the intervention stalled the rally, and, initially, drove a counter-trend move that stopped out several longs along the way.
Buyers were somewhat undeterred though as support simply played from the 145.00 handle and price bounced back-up, albeit in a more tepid fashion than it had broken out in the prior weeks.
But – the simple fact that the BoJ had theoretically capped the upside for the pair was enough to keep the market in a state of limbo for long enough until change could show on the horizon.
That change showed on the morning of November 10th, 2022, with a below-expected CPI report. To be clear – the prints were still massive, with Core CPI coming in at 6.3% and headline CPI at a whopping 7.1%. But – both data prints were below the expectation and reduction from the prior month’s prints.
Hurriedly, markets factored in this new information and longs that had held on through the initial intervention-fueled pullback bailed on the trade, leading to the start of a dizzying reversal that lasted for the next two months and drove the pair lower by almost 2,000 pips.
USD/JPY Daily Chart – September 2022 - 2023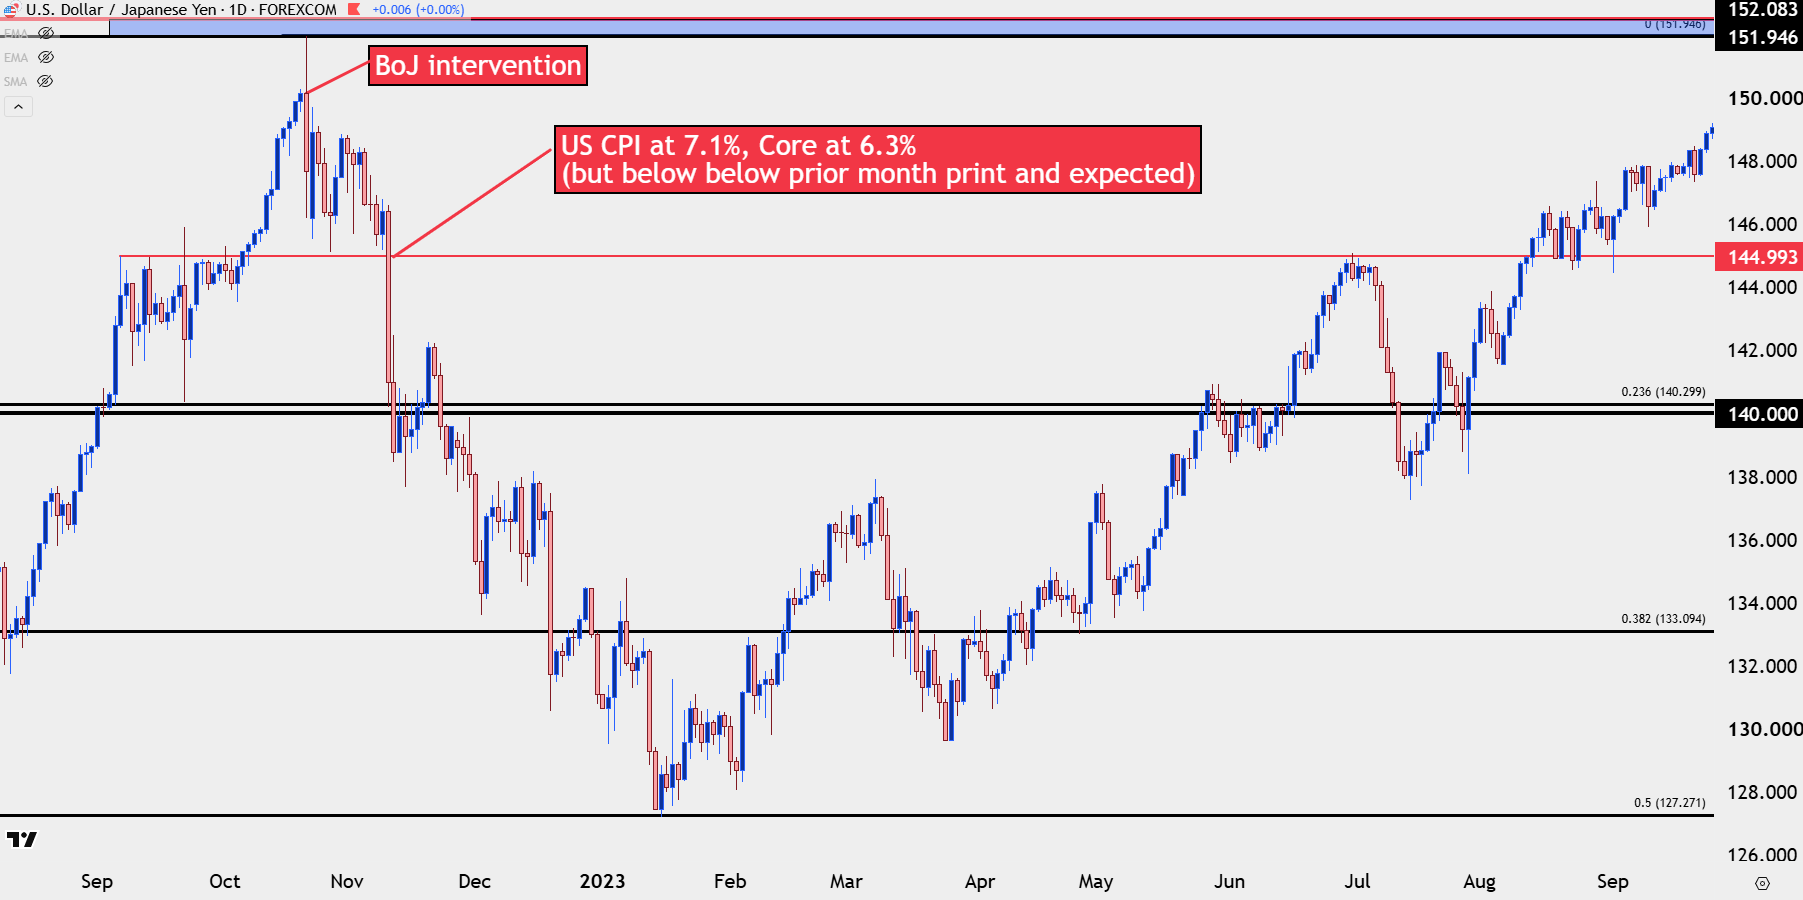
Chart prepared by James Stanley; data derived from Tradingview
Relevance to Current Day in USD/JPY
At this point a similar dynamic exists as we had back in 2022, where there’s expectation for more US rate hikes while Japan sits at inflation levels below 2%. And we just saw a very loud and showy appearance from Scott Bessent regarding intervention.

Like I said in the weekend video, intervening with price around or below 155.00 makes little sense, but as price perks up that desire to tilt the flow of the market can similarly increase and that can provide that theoretical cap that I referred to earlier. Will policymakers stand by to allow USD/JPY to float back above 160 again? And even if they do tip-toe back above that line-in-the-sand, will markets be able to re-challenge that 164.00 level?
Regardless of the answer, the question must be considered when factoring in topside targets for the pair and at this point it seems aggressive to look for targets significantly above either of those levels, which can cap the projected upside on the long side of the pair.
And on the other hand, right now markets are holding on to a firm belief that the Fed will hike rates later this year. It’s still too early to say that they won’t as a flare in inflation will probably require that they do. But, going off of last week’s rate decision, it really seems as though Kevin Warsh wants to sound like an inflation hawk without actually being an inflation hawk. This, if course, would be an evolution in the Fed’s messaging which has for years used comments around rate policy to push around market trends.
This can leave USD/JPY in a vulnerable spot, where upside for longs has a cap, of some sort, while a worsening of data brings on even larger downside risk.
But, that’s not the market participant to consider, in my opinion. The one to keep in mind is the one that’s often most driven by those interest rate disparities, and that’s the actual carry traders that are borrowing in Japan while rates are extremely low and then investing elsewhere where rates are much higher. This can be considered as a form of arbitrage but it’s not truly risk free, even if investing in government bonds, and the reason is that loans in Japan are taken in Yen, and if the Japanese Yen depreciates, it can whittle away any potential profit in the spread and then some.
And these aren’t the type of market participants to just summarily dismiss something as clearly identifiable as currency risk. So, they’ll hedge that risk by selling JPY in the marketplace and buying another currency, like USD. This further adds pressure to the upside in USD/JPY spot rates and this is another reason things like overbought matter little when those rallies are running.
But this can work both ways, right? Because if a hedge fund has a trade on to offset that currency risk – and it’s clear that the move has largely topped-out as you have both economies literally telling you that they want prices to move down, well, it makes little sense to remain in that hedge for much longer, and that’s when the currency risk from the initial carry trade isn’t such a daunting prospect. And, potentially, some profit can be pocketed by closing the hedge at a gain and merely re-buying it later, down the road, to offset that currency risk again when the Japanese Yen isn’t so cheap.
This is one reason why USD/JPY bounced back so quickly in January of 2023, or December of 2023. Or, even in September of 2024 with the pair bottoming literally two days before the Federal Reserve cut rates by 50 basis points. The pair then went on to rally by 1800 pips over the next four months and, again, this is through an FOMC rate cut cycle. But – the fundamental divergence remained and there was a reason for carry traders to hedge that currency risk again.
USD/JPY Daily Chart - 2024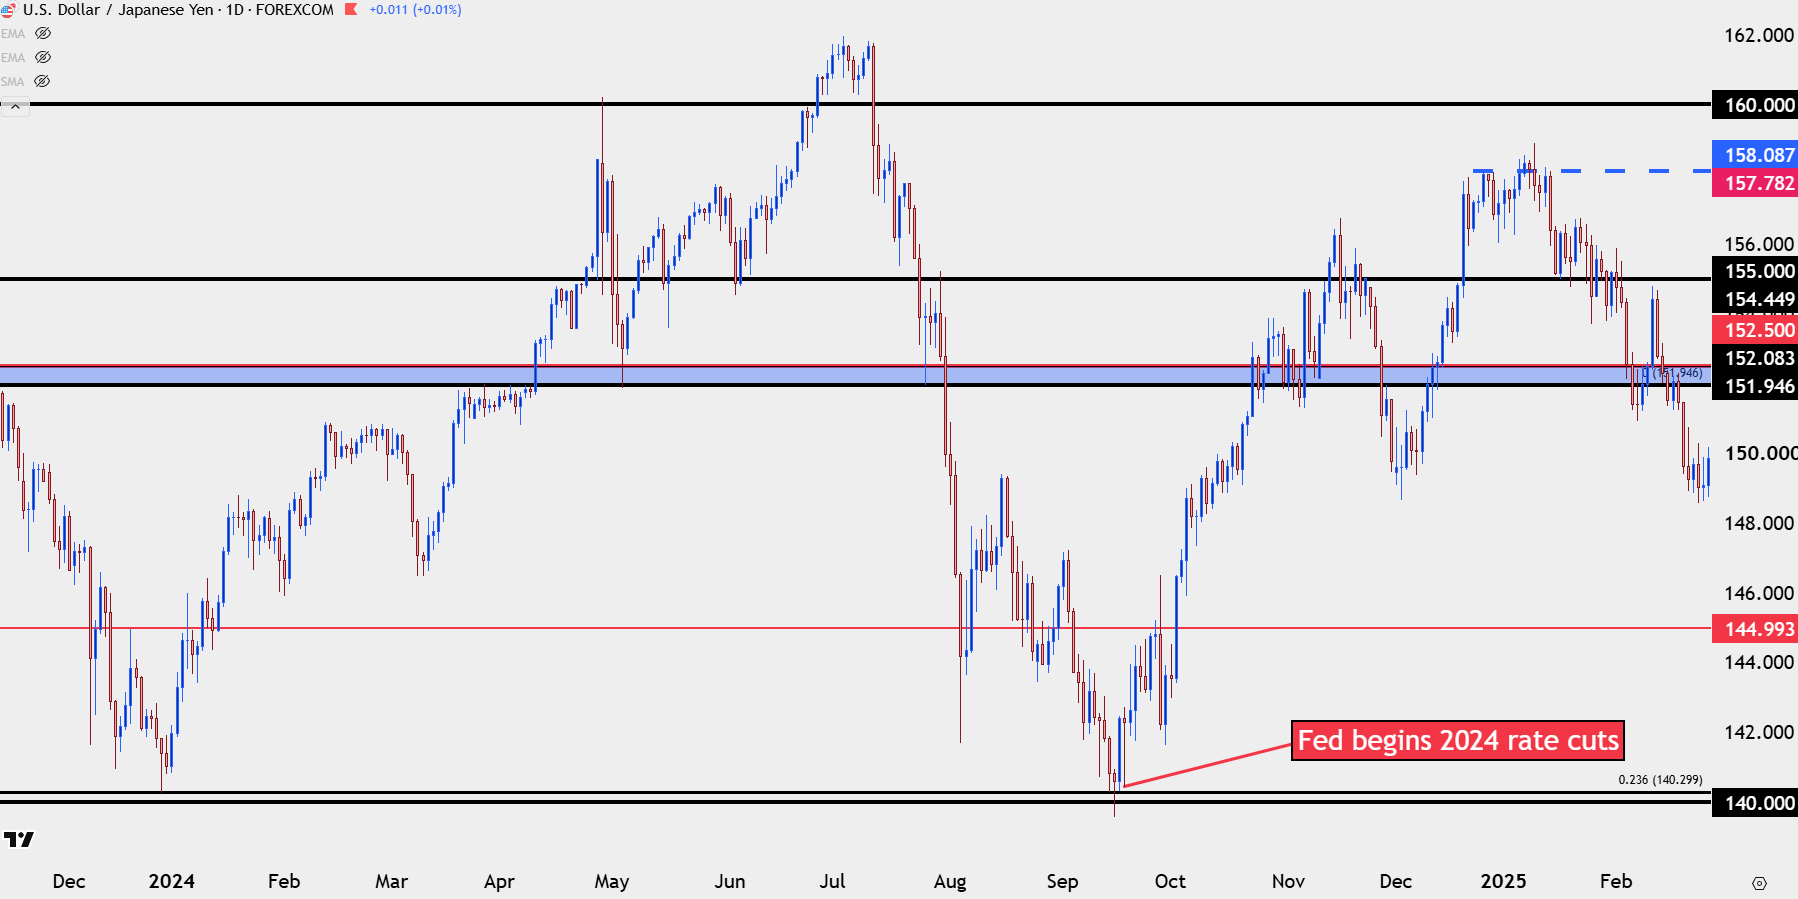
Chart prepared by James Stanley; data derived from Tradingview
USD/JPY Current Day
At this point bulls aren’t entirely out of the matter yet and the current weekly bar, at just the half-way point of the week, is actually somewhat bullish given the reaction that we’ve seen above the 155.00 support zone. But – this matter is far from over and we’re now in a spot where US data is perhaps even more important, as a dimming in US data will likely entail a reduction in rate hike odds out of the US, and that, combined with a theoretical cap to upside in the pair can create a compelling reason for carry traders to release their hedges.
For now, we have resistance at a familiar spot – the same that topped the USD/JPY market after that 2024 rally. It’s difficult to get too bullish above 160.00, at this point, at least in my opinion, and that could cap the theoretical upside to the trade. While support can still remain attractive, at least for now, diminishing upside is something that, eventually, can lead to reversal scenarios as longs cut positions, particularly if US data softens to the point that rate hike probabilities get priced-down.
At this point, the four hour chart isn’t quite in a bearish spot and there’s actually a bullish formation in-place now with an ascending triangle. But if or when this starts to change, the contrarian view can grow in attraction.
USD/JPY Four-Hour Chart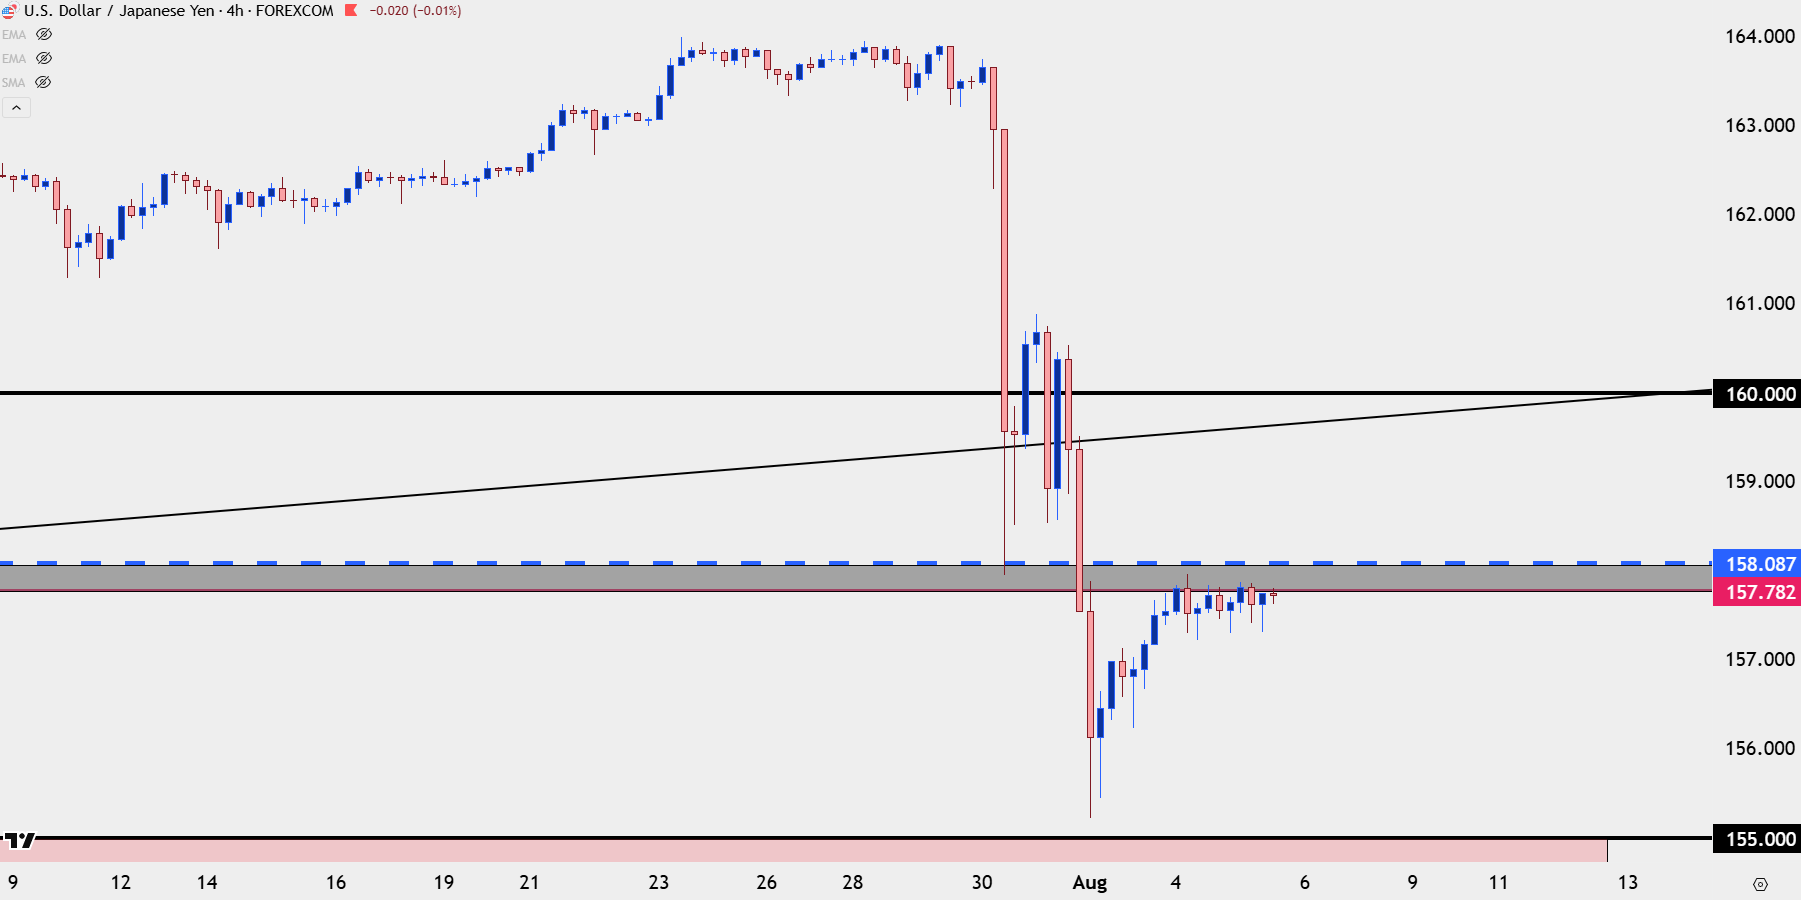
Chart prepared by James Stanley; data derived from Tradingview
--- written by James Stanley, Senior Market Analyst, Global Macro