Wall Street futures have found support after a choppy week, improving the backdrop for Asian equities. The ASX 200 and Nikkei are showing early signs of a technical bounce, although key resistance levels still need to be overcome.
View related analysis:
- Gold Price Rebound? Futures Positioning Signals Support Above 4,000
- Australian Dollar Slumps Amid Tech Selloff, Surging USD Ahead of Key Data
- ASX 200 Outlook: A Bounce Is Brewing, But Data Risk Looms
- ASX 200 Outlook: Energy Stabilises, Tech Tests Support
Wall Street Stabilises as ASX 200 And Nikkei Eye a Stronger Bounce
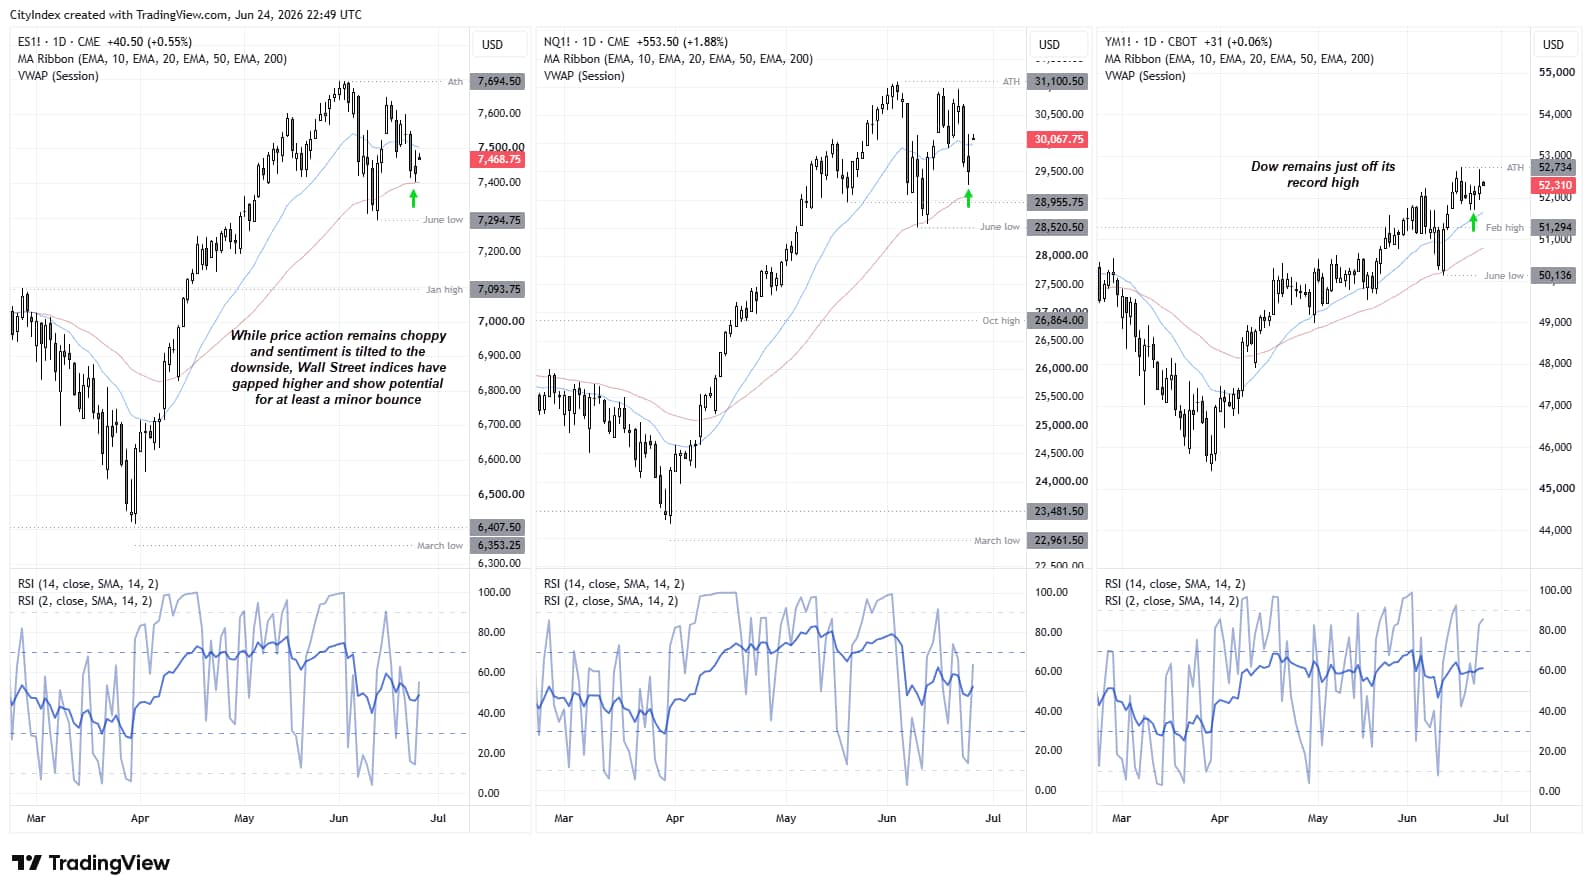
It’s not been a great week for Wall Street indices, yet it’s not been a terrible one either. The days of hitting record highs session after session appear to be on pause for now. Instead, price action has turned choppy, even if sentiment remains tilted to the downside.
Regardless, bearish momentum waned on Wednesday, with S&P 500 futures finding support at their 50-day EMA and the 7,400 handle. The Nasdaq 100 printed a narrower range with upper and lower wicks, highlighting two-way trade, and largely held between its 20 and 50-day EMAs. Meanwhile, Dow Jones futures managed a modest gain of 0.4% and trade just below their all-time high. All three Wall Street index futures have also gapped higher at today's daily open.
This is hardly a compelling case for a strong rally in isolation, but it could bode well for Asian indices today, especially given the bullish price action already seen on the ASX 200 and Nikkei. That is why I am on guard for a bounce heading into the weekend.
Source: CME, CBOT, TradingView
ASX 200 (XJO) Technical Analysis
Daily Chart Points to Scope for a Relief Bounce
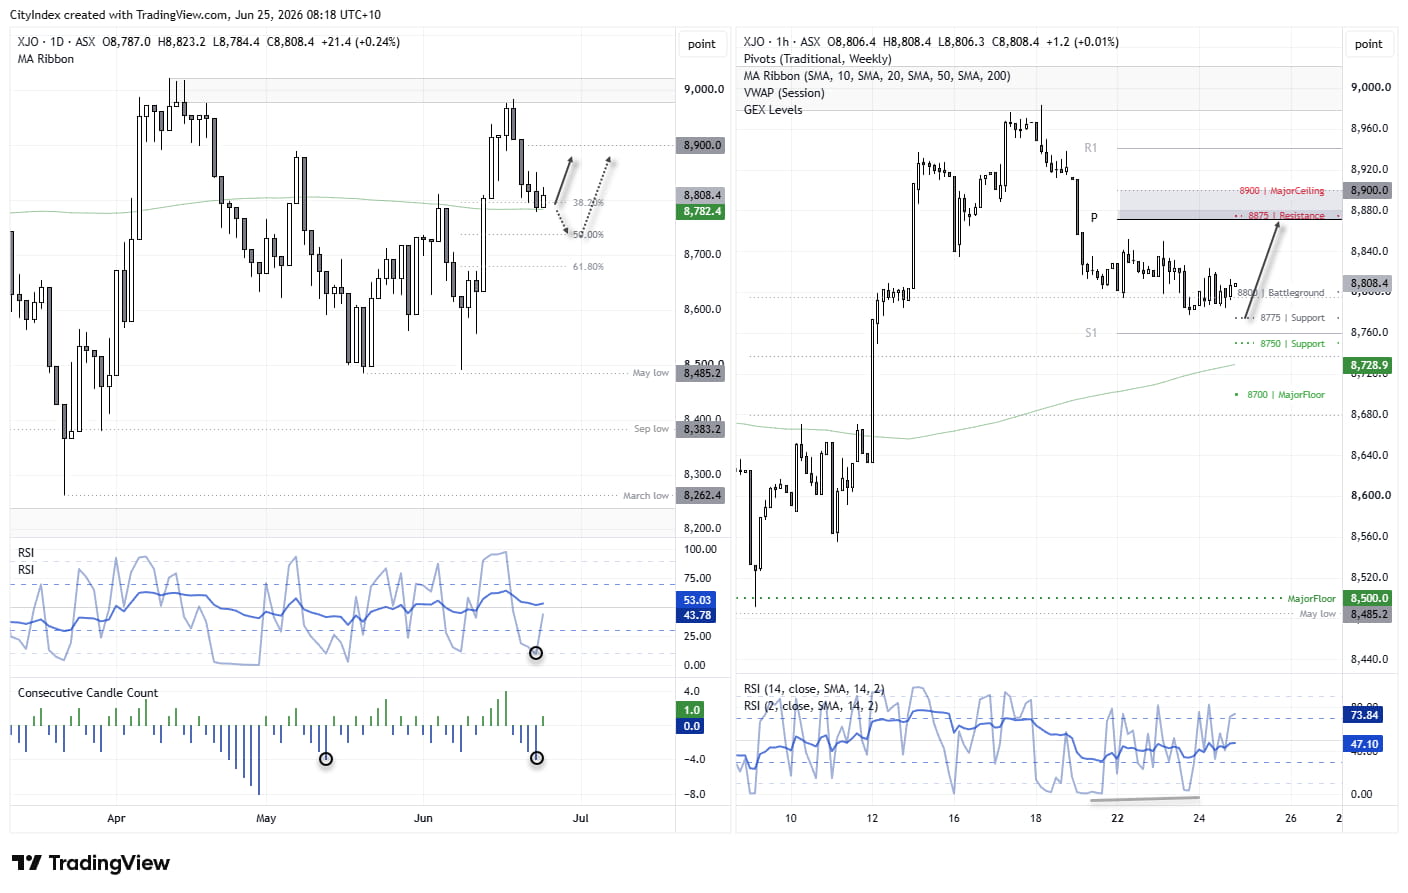
I floated the idea of a bounce for the Australian stock market earlier this week, though we’re yet to see any meaningful follow-through. Still, the ASX 200 cash market managed to form a small bullish inside day above its 200-day SMA on Wednesday, so it is at least a start. This saw the ASX snap its 4-day losing streak – whish was its most bearish streak since Mid-May.
The fact that the daily RSI (2) was oversold on the fourth day and the pullback from its recent cycle high sits around a 38.2% Fibonacci level hints at a minor bounce over the near term. But we could also consider the potential for a larger move higher, given the daily RSI (14) is trending higher with prices and not yet overbought.
This content was created by an affiliate of FOREX.com and represents the views and opinions of the author/speakers, not the views and opinions of FOREX.com, StoneX Group Inc., or its subsidiaries. The content has not been independently reviewed by FOREX.com.
Employment Data and GEX Levels in Focus
The 1-hour chart shows momentum surging above the weekly pivot after Nikkei futures found support at the monthly S1 pivot on Wednesday. However, while the breakout was accompanied by higher volume, it was not especially convincing. That leaves the door open for at least a minor pullback today.
Also note that the monthly R2 pivot sits just above 71,500 and could provide initial resistance. From a trading perspective, a pullback would actually be preferable, allowing bulls to seek a more favourable reward-to-risk entry ahead of a potential break above the monthly R2.
Source: ASX, TradingView

Nikkei 225 Futures Technical Analysis
Historic Bull Market Shows Few Signs of Slowing
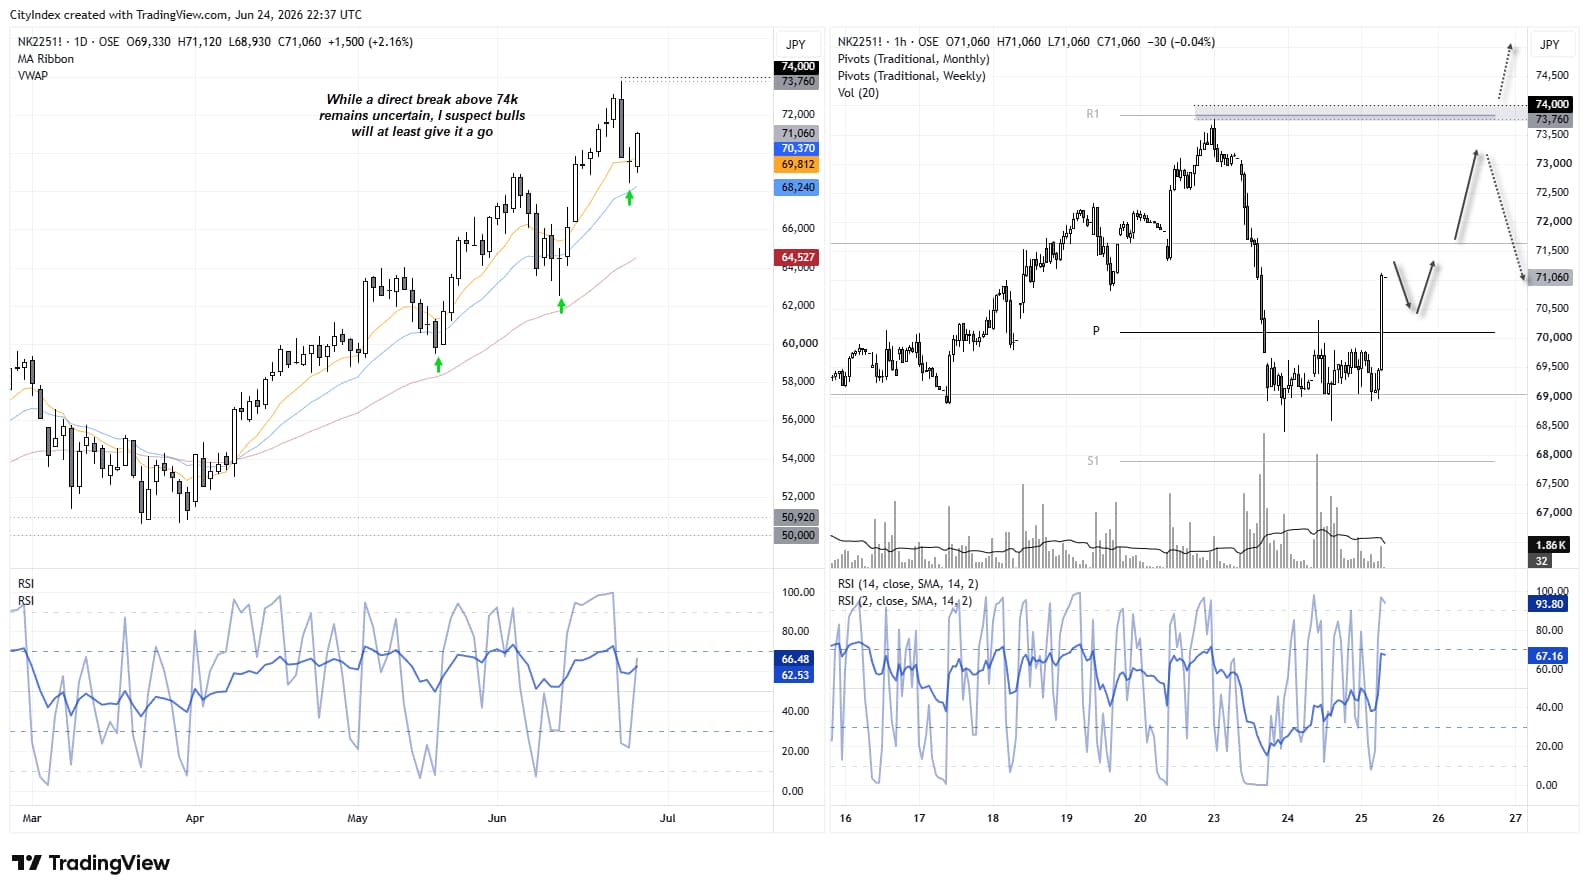
To say the Nikkei is amid a strong uptrend would be quite an understatement. Not only has it reached multi-decade highs, but its rallied 142% since the April 2025 low. A top will surely arrive at some point – but for now, bulls are highly focussed on dip. And one may have formed already.
The daily chart shows that momentum is curling higher after Tuesday’s shakeout. A Rikshaw man doji formed between the 10 and 20-day EMAs on Wednesday, and momentum extended higher overnight into the US close. Whether bulls can break the Nikkei to fresh highs beyond 74k remains to be seen, but it does at least heave a bullish bias heading into today’s Asian session. And bulls could be seeking dips on the lower timeframes.
Momentum Rally Faces Initial Resistance
The 1-hour chart shows momentum surging above the weekly pivot after Nikkei futures found support at the monthly S1 pivot on Wednesday. However, while the breakout was accompanied by higher volume, it was not especially convincing. That leaves the door open for at least a minor pullback today.
Also note that the monthly R2 pivot sits just above 71,500 and could provide initial resistance. From a trading perspective, a pullback would actually be preferable, allowing bulls to seek a more favourable reward-to-risk entry ahead of a potential break above monthly R2.
Source: OSE, TradingView