
As the third week of October begins, the cryptocurrency market has started to deepen its bearish bias, reflecting a gradual loss of confidence in the short term. This shift has led to the breakdown of key technical levels on the charts of major cryptocurrencies, suggesting that the dominant market momentum has turned clearly bearish. For now, investor caution continues to drive selling pressure as the leading market force, particularly among the top cryptocurrencies, which may remain weak in the coming sessions.

Performance of Major Cryptocurrencies
Source: Data - StoneX, Tradingview
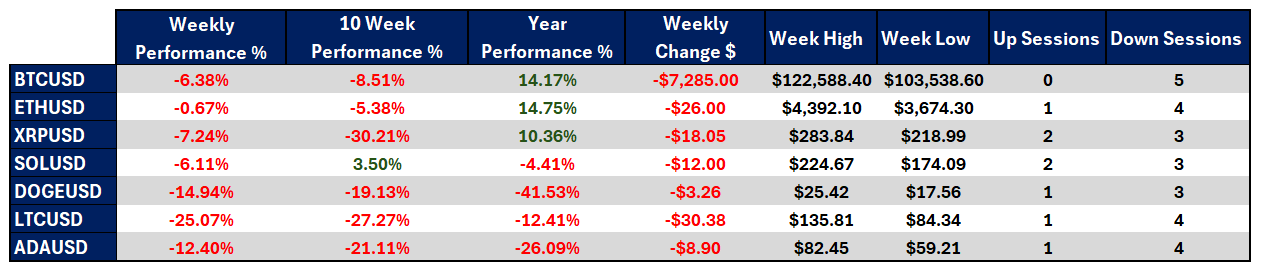
- Ethereum has been the only cryptocurrency able to limit its losses, posting a modest decline of -0.67% compared with the previous week’s close. In contrast, Litecoin has been the most affected, dropping by more than 25%.
- Over the past 10 weeks, Solana continues to lead the market with a cumulative gain of 3.5%, while Ripple (XRP) remains the worst performer, with a 30.21% decline.
- On a year-to-date basis, Ethereum remains the best-performing cryptocurrency, with a 14.75% increase despite recent corrections, whereas Dogecoin has suffered losses exceeding 40%, maintaining the lowest long-term performance among major assets.
- Bitcoin has reached a new low around $103,000, approaching the psychological level of $100,000 per BTC, not seen in several trading sessions.
- Overall, the major cryptocurrencies are facing strong selling pressure, as the persistent bearish sentiment has led Bitcoin to post a five-day losing streak, solidifying the bearish bias as the dominant market trend.
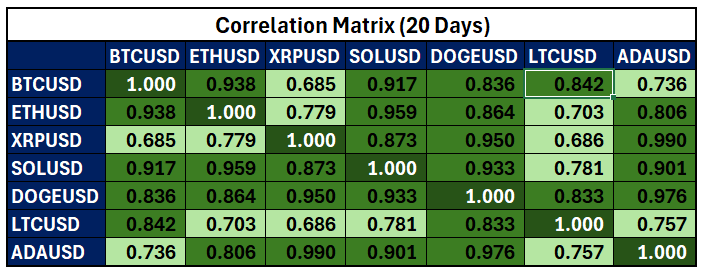
Colors from red to green – Red indicates negative correlations, and green indicates positive correlations.
Source: Data - StoneX, Tradingview
Since the bearish bias began, there has been a notable increase in the positive correlation between major cryptocurrencies and Bitcoin (BTC). Most currently show a correlation coefficient above 0.8, with Ripple (0.68) and Cardano (0.73) being the only exceptions. This indicates that as Bitcoin undergoes significant corrections, the broader market tends to follow its downward behavior, although Ripple and Cardano have done so to a lesser extent.
Similarly, the correlation among the six largest cryptocurrencies after Bitcoin has also risen, with no coefficients below 0.7. This trend highlights how lack of confidence and selling pressure have spread across the entire crypto market, with no major coin managing to resist the downward trend.
Taken together, this high-correlation environment reflects a market increasingly synchronized with Bitcoin’s declines. The persistent selling pressure continues to reinforce the interdependence among major crypto assets, underscoring a broad loss of investor confidence compared to traditional markets.
It’s important to note that these correlation coefficients may change as trading sessions progress.
Bitcoin Approaches Key Support
Source: StoneX, Tradingview
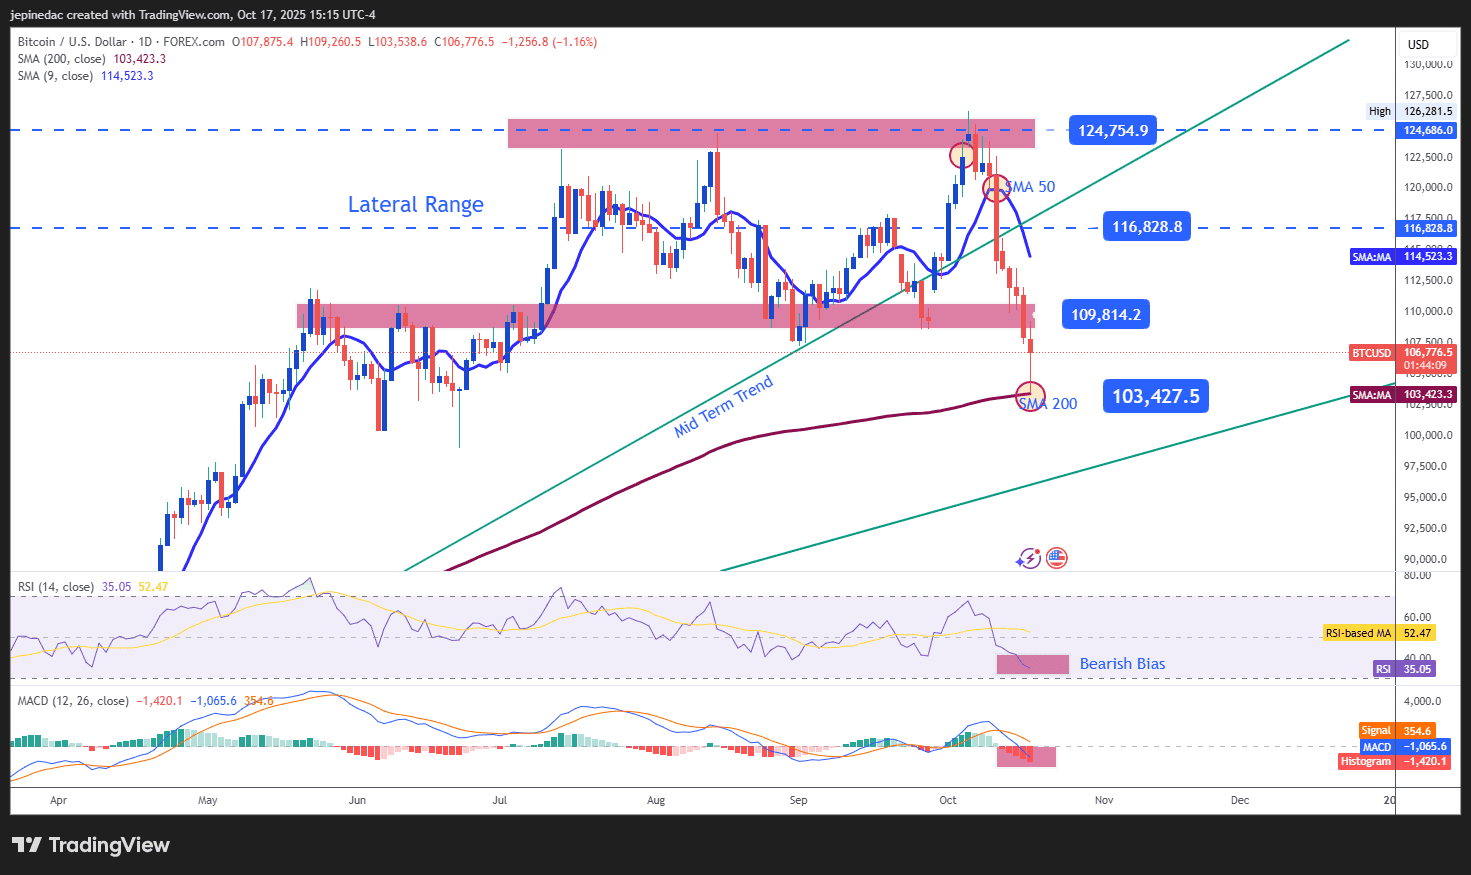
Toward the end of the week, Bitcoin has extended its five-session losing streak, showing a dominant bearish tone in the short term as the price moves closer to key support levels. The recent downward movement broke through the sideways channel that had been holding between $124,000 and $109,000, opening the door to a new short-term downtrend if selling pressure persists.
Indicators:
- Both the RSI and MACD remain below their neutral levels (50 and 0, respectively), indicating dominant short-term selling momentum. However, the RSI is approaching the oversold zone (level 30), suggesting excessive selling pressure that could lead to technical rebound opportunities in the coming sessions.
Key Levels:
- $116,000 – Major Resistance: Represents the midpoint of the former sideways channel and serves as the main bullish barrier. A sustained move back to this level could reactivate the broken range and provide a potential setup for the previous uptrend.
- $109,800 – Near-Term Barrier: Marks the former lower boundary of the channel and could act as a temporary technical resistance during possible rebound attempts.
- $103,000 – Key Support: A level not seen since June of this year, aligned with the 200-period simple moving average. A break below this area would confirm a structural bearish shift, paving the way for a new downward trendline.
Solana Breaks Its Multi-Month Uptrend
Source: StoneX, Tradingview
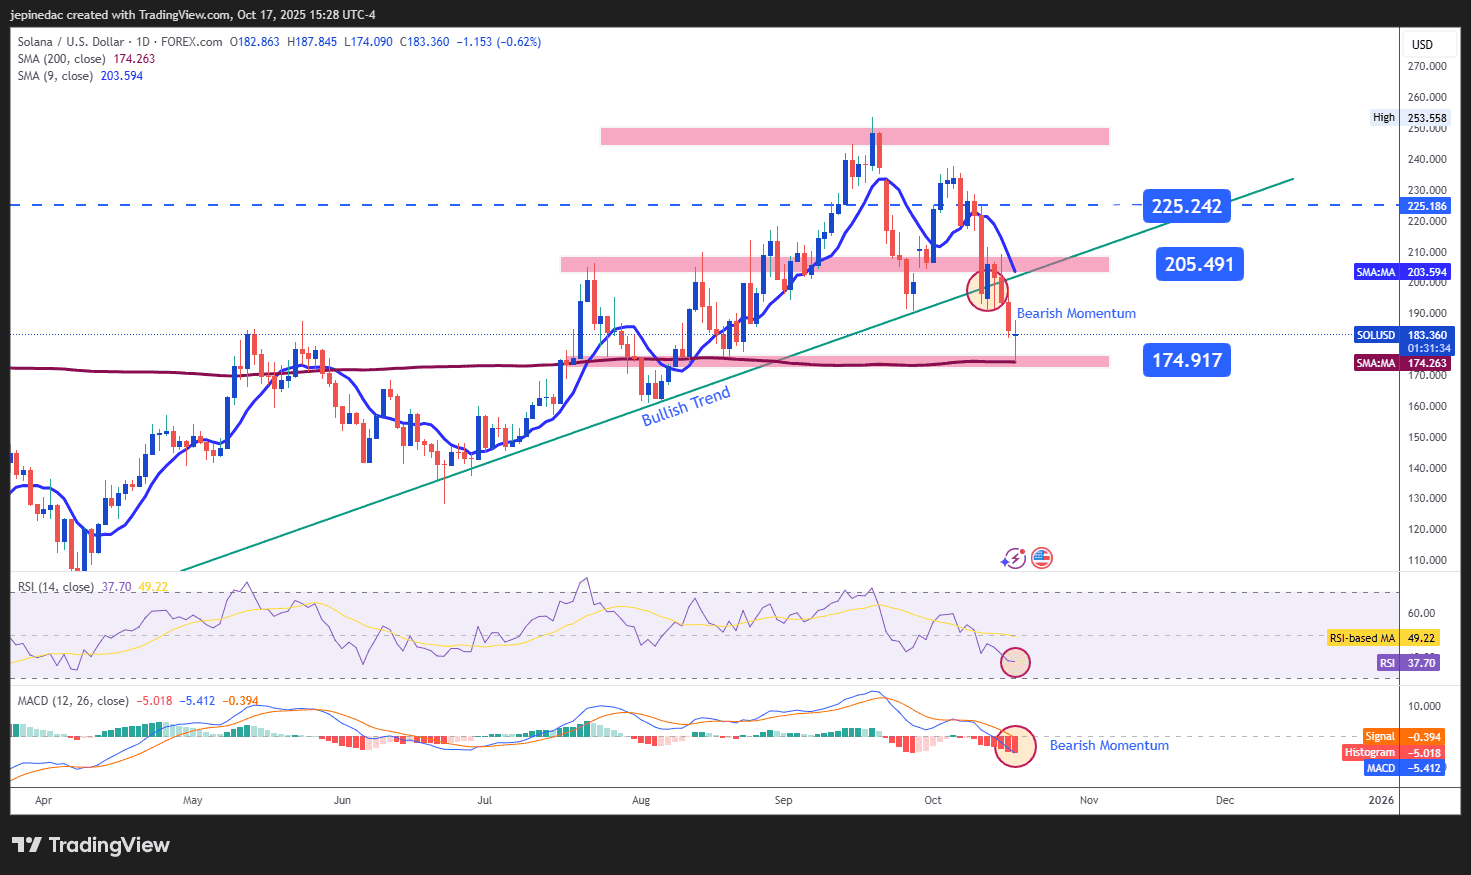
Solana ended the week with three consecutive bearish sessions, accumulating a decline of more than 6% in the short term. The selling pressure pushed the price below the $200 mark, triggering a bearish crossover with the uptrend line that had been in place in prior sessions. This breakdown confirms a loss of bullish dominance and could signal a more pronounced bearish phase in the coming days.
Indicators:
- Both the MACD and RSI are oscillating below their neutral levels (0 and 50, respectively), reinforcing the downward momentum and selling pressure in the short-term moving averages. If both indicators continue to decline, the bearish trend could solidify further in upcoming sessions.
Key Levels:
- $225 – Major Resistance: Represents a round-number psychological level aligned with recent highs. A recovery toward this zone could reactivate the previous uptrend.
- $205 – Current Barrier: Corresponds to a recent retracement area, near the psychological level of $200. Price action holding within this range could indicate a phase of technical indecision.
- $174 – Key Support: Matches the 200-period simple moving average and stands as the most critical bearish barrier. A sustained break below this level would confirm a dominant selling bias and potentially lead to a new downtrend in the short term.
Written by Julian Pineda, CFA – Market Analyst
Follow him on: @julianpineda25