As January 2026 draws to a close, the cryptocurrency market has struggled to sustain its recent recovery, once again showing consistent weakness in recent sessions. The bullish bias has failed to stabilize, and a scenario of prevailing neutrality is beginning to take shape, indicating that the rebound in demand has been insufficient to eliminate the threat of structural selling pressure.
In this environment, most major cryptocurrencies have been unable to establish clear short-term trends. If this state of indecision persists, the market may continue to develop more defined sideways ranges, limiting the emergence of meaningful directional moves in the near term.

Performance of major cryptocurrencies
Source: Data - StoneX, Tradingview
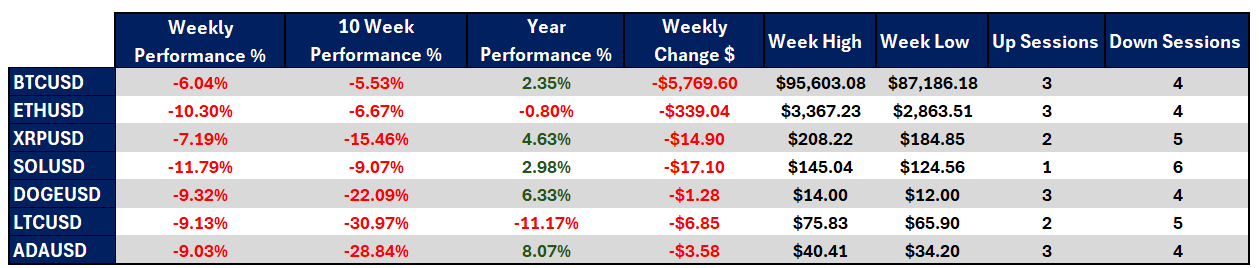
- The most affected cryptocurrency of the week has been Solana, posting a -11.79% decline over the last seven sessions, positioning itself as the asset with the strongest structural weakness in the short term. In contrast, Bitcoin has shown greater relative stability, with a decline of -6.04%, standing out as the cryptocurrency that has lost the least value over the same period.
- Looking at performance over the last ten weeks, the crypto market as a whole continues to trade below the levels seen toward the end of 2025. Within this horizon, Litecoin stands out as one of the weakest assets, with a -30.97% decline, while Bitcoin once again shows greater resilience, registering a more moderate -5.53% drop, partly explained by its role as the market’s reference asset and its relatively low volatility compared to the rest of the sector.
- As the year progresses, several cryptocurrencies are already trading below their annual opening prices. Once again, Litecoin is the most affected, down -11.17% relative to its 2026 opening level. By contrast, Dogecoin shows the strongest year-to-date performance, with gains of 6.33%, a notable outcome considering it was one of the worst-performing cryptocurrencies during 2025.
- As the market’s benchmark asset, Bitcoin has failed to reclaim the $100,000 level. The closest level reached during the week was the $95,000 area, while price continues to print recurring lows around the psychological $90,000 zone in the short term.
- Overall, the week has been negative for the crypto market. Despite some recovery attempts, demand has not been strong enough to prevent the persistence of ongoing indecision, which could remain dominant in the coming sessions.
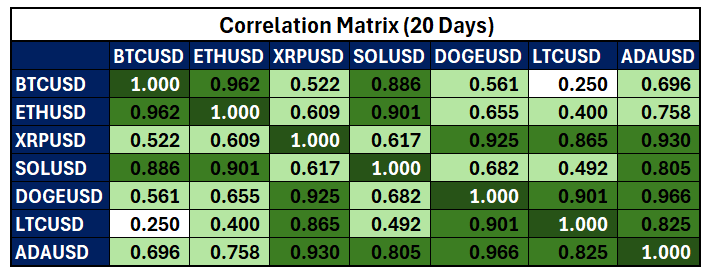
Colors from red to green – red for negative correlations and green for positive correlations
Source: Data - StoneX, Tradingview
From a correlation standpoint, several cryptocurrencies have begun to show reduced synchronization with Bitcoin in the short term. This is the case for Ripple, with a correlation coefficient near 0.50; Dogecoin, at 0.56; Cardano, at 0.69; and notably Litecoin, whose coefficient drops to 0.25 when averaged over the last 20 sessions. It is important to note that correlation coefficients can change over time.
This behavior suggests that the crypto market is starting to fragment, with assets increasingly acting as individual markets rather than moving in a homogeneous direction. In this context, a meaningful advance in Bitcoin no longer guarantees a similar reaction across the broader market, as capital appears to be prioritizing specific assets instead of the crypto ecosystem as a whole. Higher-cap cryptocurrencies such as Bitcoin have managed to maintain relative stability, while lower-cap assets may be more exposed to the lack of consistent demand. If this dynamic persists, Bitcoin may continue attempting to move higher without the rest of the market following in a synchronized manner, reinforcing an environment of generalized indecision and divergent behavior among cryptocurrencies.
Bitcoin returns to a neutral scenario
Source: StoneX, Tradingview
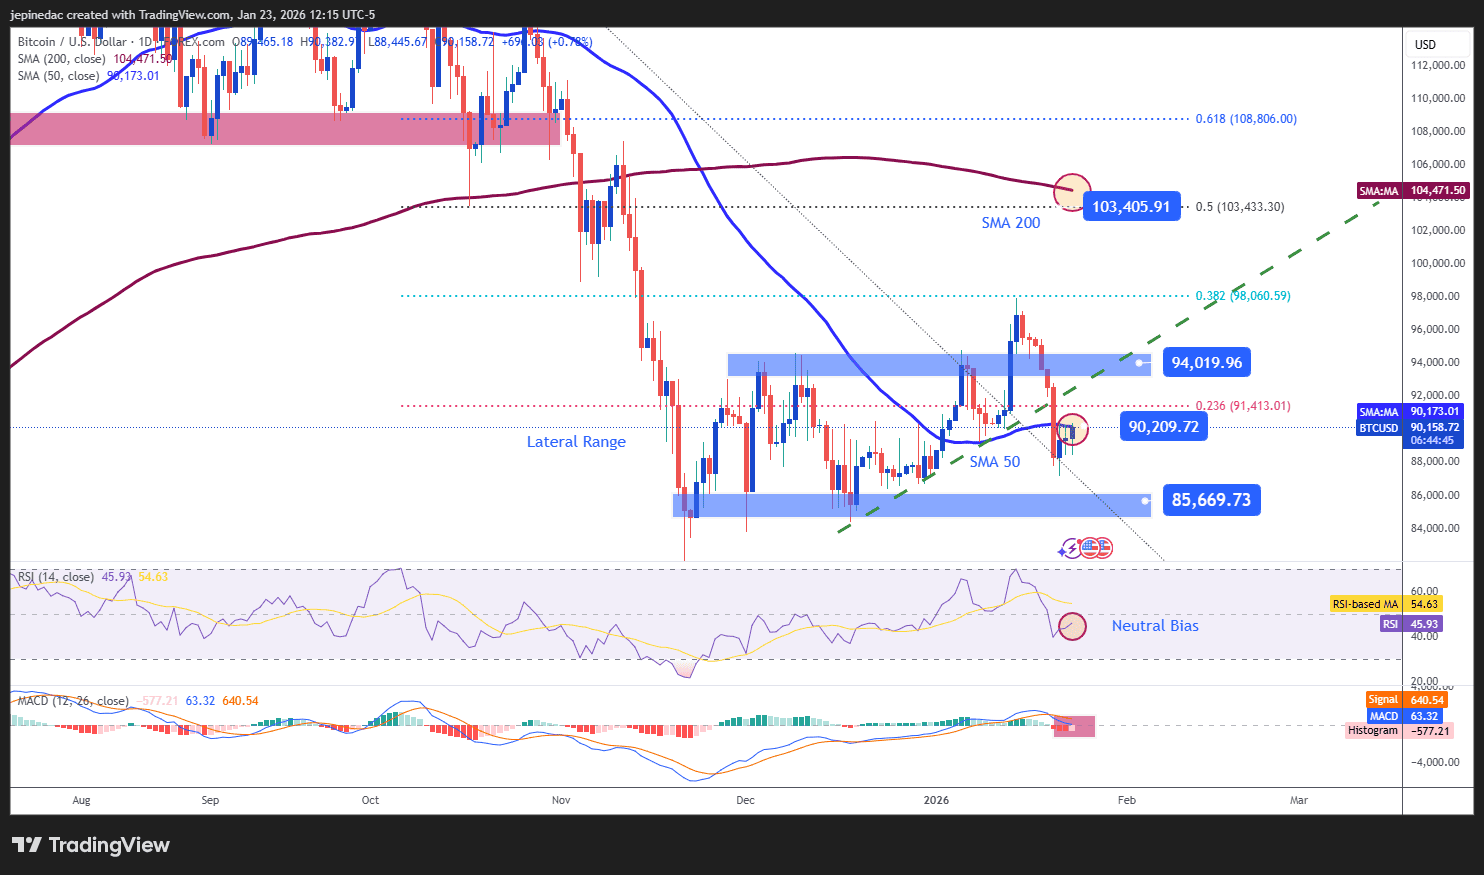
Although Bitcoin has been one of the cryptocurrencies that has best resisted selling pressure in recent weeks, the latest bullish attempts have not been sufficient to establish a clear uptrend. Price has now returned to a short-term sideways range, capped near $94,000 and supported around $85,200. As long as price action remains unable to break out of this neutral range, it will be difficult to observe a meaningful directional move in Bitcoin in the coming sessions.
Indicators:
- Both the RSI and MACD are hovering near their neutral levels (50 and 0, respectively). This suggests that average momentum and short-term moving average strength reflect a state of indecision, reinforcing the relevance of the current sideways range.
Key levels – Bitcoin:
- $94,000 – Key resistance: aligns with the upper boundary of the sideways range. A sustained breakout could enable the formation of a new bullish trend.
- $90,200 – Nearby barrier: a neutral zone aligned with the 50-period simple moving average; price action around this level may extend the dominance of the sideways range in the short term.
- $85,669 – Definitive support: the lows of recent months. A break below this level could reactivate a broader bearish trend, similar to what was observed in the second half of 2025.
Solana remains the weakest cryptocurrency of the week
Source: StoneX, Tradingview
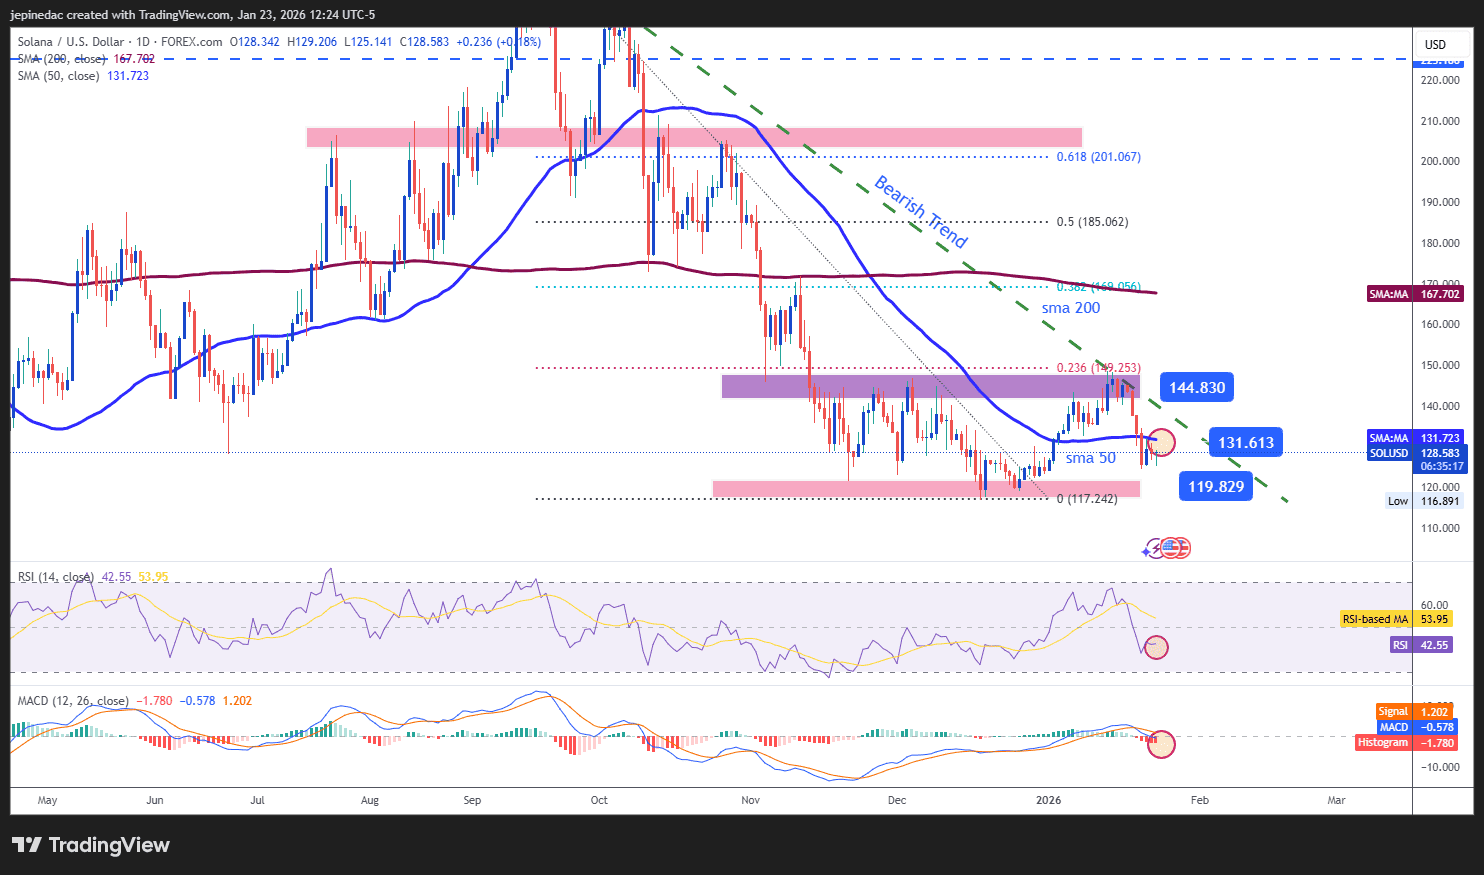
Solana continues to be the asset with the largest weekly decline. Recent weakness has once again highlighted the bearish trendline in place since September 2025, which remains the dominant technical structure. So far, no bullish correction has been strong enough to threaten this formation.
Indicators:
- Both the RSI and MACD remain below their neutral levels, indicating that selling momentum and downside pressure in short-term moving averages remain dominant. As long as this behavior persists, selling pressure is likely to remain relevant for Solana.
Key levels – Solana:
- 144.83 – Key resistance: aligns with the bearish trendline and the 23.6% Fibonacci retracement. A sustained move above this level would put the bearish structure at risk and open the door to a more meaningful bullish bias.
- 131.61 – Nearby barrier: a relevant neutral zone aligned with the 50-period simple moving average. Prolonged price action around this level could reinforce a short-term sideways range.
- 119.82 – Definitive support: aligns with recent lows. A return to this area would reaffirm selling pressure and could enable an extension of the bearish trendline in the coming sessions.
Written by Julian Pineda, CFA, CMT – Market Analyst
Follow him on: @julianpineda25