The first week of October is coming to an end, and with it, there are signs of a temporary return of confidence in the cryptocurrency market. Major digital assets have posted steady gains this week, and some, like Bitcoin, are preparing to approach historical highs once again. As long as confidence holds, buying pressure could remain a relevant factor in the coming sessions.

Performance of Major Cryptocurrencies
Source: Data - StoneX, Tradingview
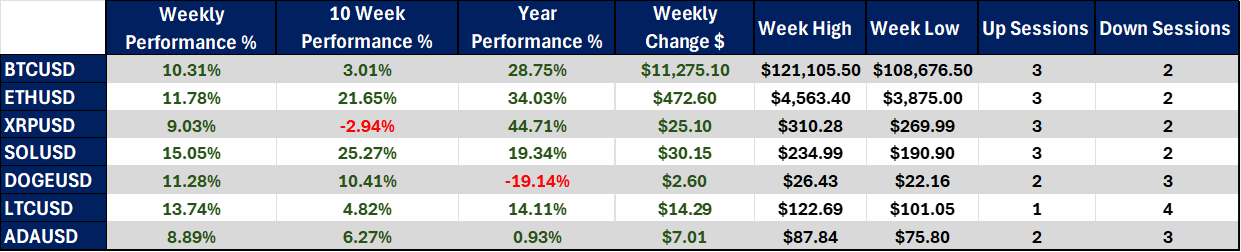
- Litecoin stands out as the best performing cryptocurrency of the week, with a gain of around 13.74%, while Cardano saw the weakest advance, below 9%.
- Looking at the past 10 weeks, Solana leads with a gain of more than 25%, while Ripple has fallen by about 3%.
- On a year-to-date basis, Ripple shows the strongest performance, up more than 44%, while Dogecoin remains the weakest, down 19%.
- During the week, 4 out of the 7 main cryptocurrencies managed to string together a three-day winning streak.
- Overall, the buying bias has begun to dominate in the short term, boosting confidence and pushing coins like Bitcoin closer to their record-high zones
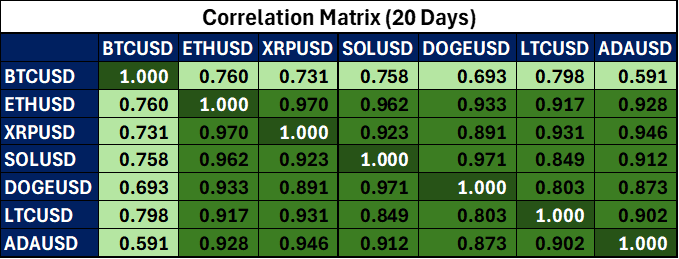
Colors from red to green – Red for negative correlations and green for positive correlations
Source: Data - StoneX, Tradingview
When it comes to correlation, notable changes are observed, particularly with respect to Bitcoin. Cryptocurrencies like Cardano and Litecoin have begun to lose positive correlation, moving toward levels of 0.59 and 0.69 respectively versus Bitcoin, based on the 20-day coefficient. This suggests that while Bitcoin continues its advance, these two assets may not track it as closely and could post neutral or even bearish sessions.
Meanwhile, correlation among the six most relevant cryptocurrencies that follow Bitcoin remains highly positive (above 0.8), reflecting a more broad-based confidence across the market. Still, it’s important to highlight that the current correlation landscape could shift in the short term.
In this context, the dominant bias remains bullish, and in general, cryptocurrencies appear to be following similar trajectories. As long as buying pressure holds, the crypto market is likely to continue posting positive results in upcoming sessions, at least from the perspective of current price action.
Bitcoin Approaches All Time Highs
Source: StoneX, Tradingview
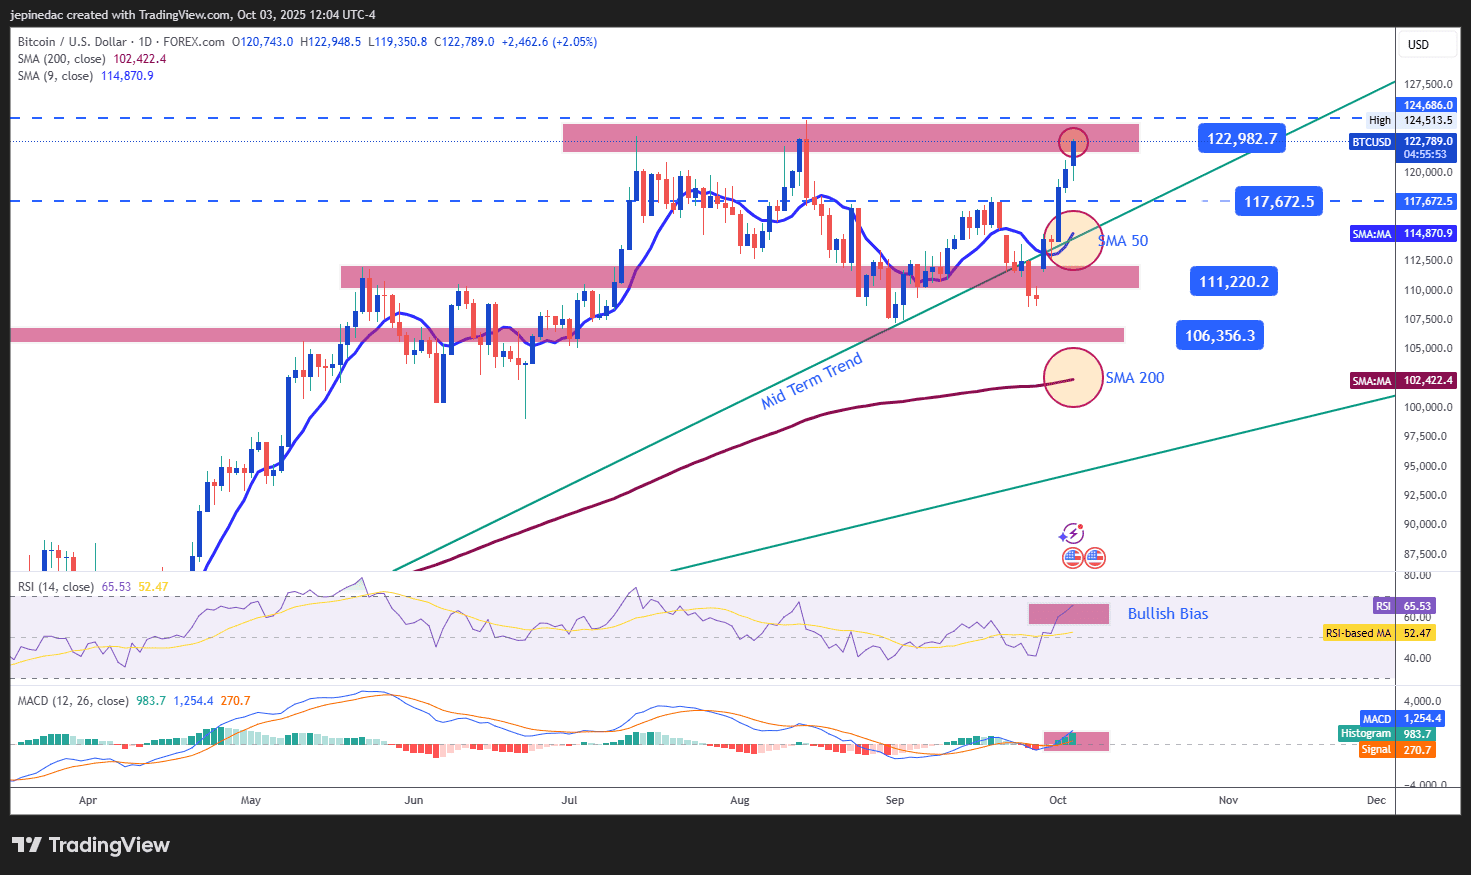
With a three-day winning streak, Bitcoin maintains steady buying pressure, allowing it to break above the $120,000 psychological level and head toward record highs. However, the speed of this recent rally could open the door to short-term pullbacks, as the historical high zone remains the most important barrier to further gains.
Indicators:
- Both the RSI and MACD remain positive, with the RSI above 50 and the MACD histogram in positive territory. This suggests that both short-term moving averages and overall buying momentum support a bullish bias. If both indicators continue to strengthen, buying pressure could intensify in the coming sessions.
Key Levels:
- $123,000 – Major Resistance: Record highs and the dominant resistance zone in the short term. A consistent breakout above would confirm continuation of the uptrend.
- $117,600 – Nearby Barrier: Mid-level of a lateral formation seen in prior weeks. A return to this zone could extend a more prolonged sideways range.
- $110,300 – Critical Support: Recent lows. A move down to this level would put medium-term bullish momentum at risk.
Litecoin Leads the Week
Source: StoneX, Tradingview
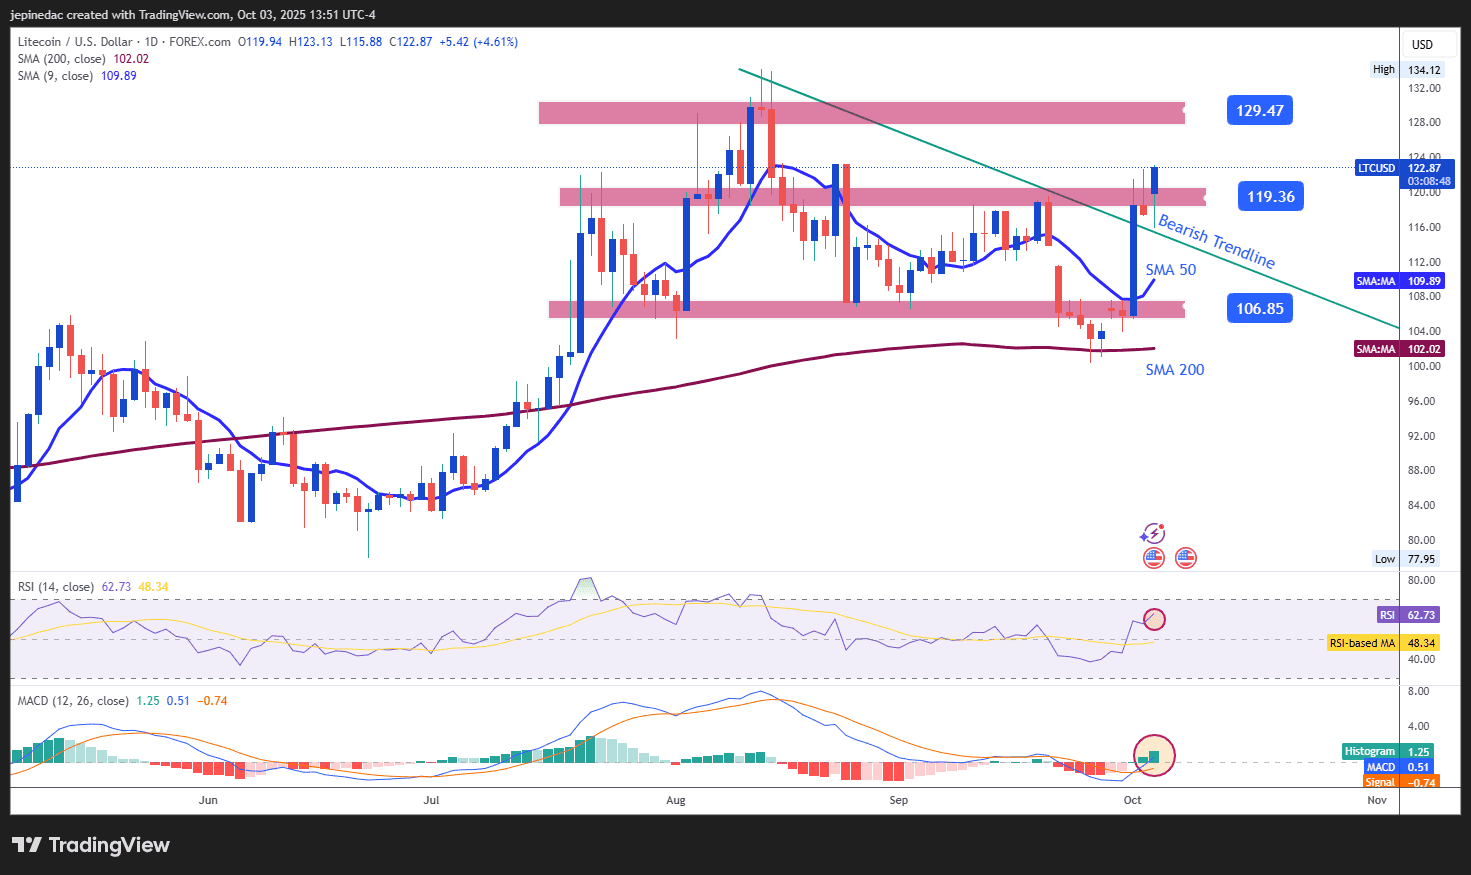
Despite recording fewer bullish sessions than some peers, Litecoin stands out as the best-performing coin of the week. It currently faces a possible downtrend line formed by descending highs. If current moves hold above this line, Litecoin could reverse its structure and enable a more significant bullish bias in the short term.
Indicators:
- The MACD remains in positive territory, signaling renewed strength in moving averages shifting toward bullish ground. However, the RSI is quickly approaching the overbought zone (70), which could create a market imbalance and open the door to short-term corrections.
Key Levels:
- $129 – Major Resistance: Recent highs. Sustained moves toward this level could fuel a more defined uptrend.
- $119 – Current Barrier: Zone of pullbacks seen in recent weeks. Holding above this level could generate a steadier bullish bias and break the short-term downtrend.
- $106 – Critical Support: Corresponds to declines below the 50-period moving average. A drop under this level would reactivate the prior downtrend.
Written by Julian Pineda, CFA – Market Analyst
Follow him: @julianpineda25