




AUD/USD Eyes 0.64 as CPI Looms, RBA and Fed Decisions in Focus
AUD/USD steady ahead of Australia’s CPI, US GDP, and Fed/BOC decisions, with key inflation data likely to drive near-term Aussie dollar direction.
Share this:

Traders have a host of key economic data to digest over the next 24 hours, including Australia’s crucial CPI print, US GDP, and interest rate decisions from both the Fed and Bank of Canada (BOC).
View related analysis:
View related analysis:
Australia’s CPI in Focus as RBA Decision Looms
Australia’s quarterly CPI figures, due out in a few hours, could be the catalyst that forces the Reserve Bank of Australia (RBA) to deliver the 25bp cut we expected at their last meeting on 12 August. As their minutes confirmed, the RBA chose to wait for more information before pulling the trigger—highlighting that CPI excluding volatile items and travel has historically been a better predictor of quarterly inflation.

Chart prepared by Matt Simpson – Data source: Australian Bureau of Statistics (ABS), London Stock Exchange Group (LSEG)
- Australia’s trimmed mean CPI is expected to have slowed to 2.7% y/y in Q2 from 2.9%, or held steady at 0.7% q/q.
- Weighted mean CPI is expected to remain unchanged at 2.1% y/y.
- Headline CPI is forecast to slow to 2.1% y/y (down from 2.4%), or 0.8% q/q (down from 0.9%).
I’d like to say that a 2.7% trimmed mean would effectively confirm an RBA cut, but the RBA have really been pushing the envelope on caution lately. Still, with the monthly CPI ex volatile items and travel already sitting at 2.6%, perhaps we’ll be treated to a 2.6% trimmed mean and a q/q print of 0.6% or lower—which could spark renewed bets of a cut in August.
Add to that the fact unemployment ticked up 0.2 percentage points to 4.3%, and the case for the RBA to act is certainly building.
Fed and BOC Expected to Hold Rates, Q2 US GDP Looms
The Federal Reserve (Fed) are expected defy Trump wishes of an interest rate cut today and hold at their 4.25 – 4.5% band. Fed fund futures imply a 97.9% probability of no action, and it is very rare for the Fed to defy market expectations without an economic catastrophe. Fed fund futures also imply a 64.7% chance of a cut in September.
Note that Q2 GDP figures are released in the hours ahead of the FOMC meeting, though they are unlikely to change Fed expectations. The Bank of Canada (BOC) are also expected to hold their interest rate at 2.75%.
AUD/USD Technical Analysis: Australian Dollar vs US Dollar
The Australian dollar has continued to grind higher against the US dollar, although the USD Index is rebounding from recent lows and the case for RBA rate cuts is building. The weekly RSI (2) on AUD/USD reached its most overbought level in four weeks—its highest since September—and has yet to reach oversold territory. This suggests AUD/USD could be due for a leg lower towards 0.64 in the near term.
That said, I’m not anticipating a particularly large pullback in AUD/USD. The weekly RSI (14) is confirming the broader bullish trend and has not yet reached overbought levels. Additionally, the RBA has limited scope to cut rates relative to current market expectations, while the case for Fed cuts is also strengthening.
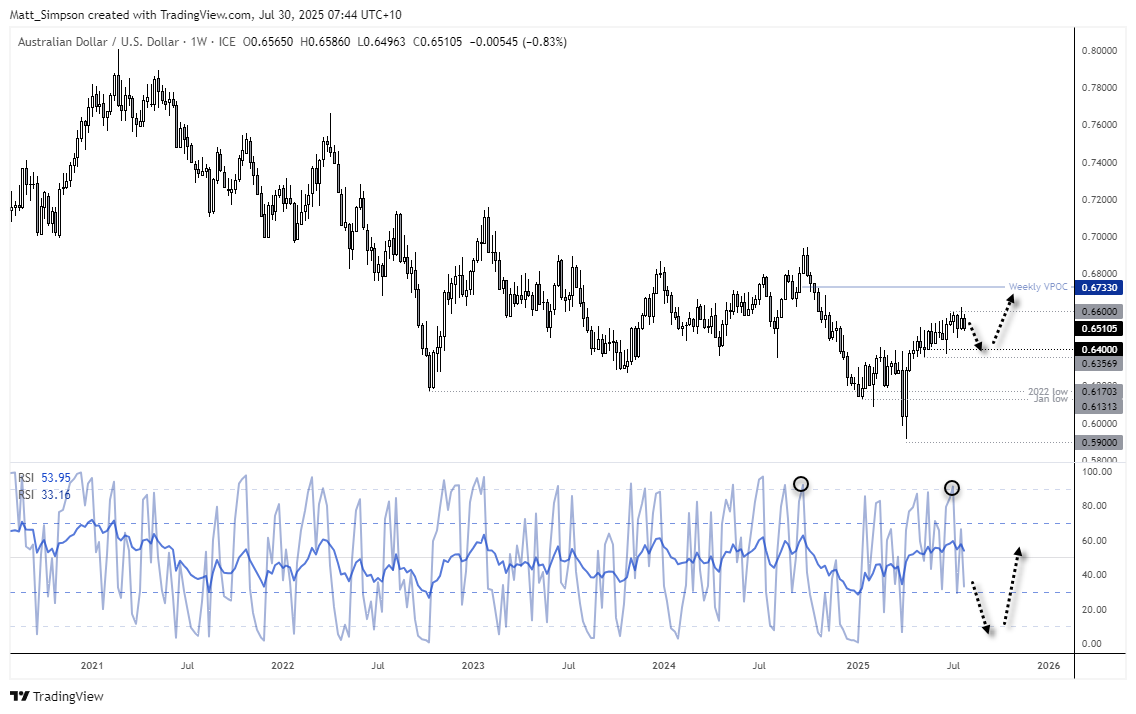
Chart analysis by Matt Simpson - data source: TradingView AUD/USD
AUD/USD Technical Analysis: Chart
While my bias remains for AUD/USD to fall to 0.64 over the coming weeks, the pair is currently trying to hold above the monthly pivot point at 0.6515 and the 50-day EMA at 0.6503. This area also aligns with a high-volume node (HVN) from price action since April. Should today’s Australian CPI data fail to convince RBA doves that a rate cut is all but certain, it raises the potential for a bounce on the daily chart before downside momentum resumes.
Furthermore, the US dollar index (DXY) has reached a key resistance level that could help limit AUD/USD losses in the near term. The daily RSI (2) is also on the cusp of reaching oversold territory.
Should a bounce materialise, we can return to the timeless classic of bears fading rallies into cycle highs—a repeatable feature of AUD/USD price action since mid-April.
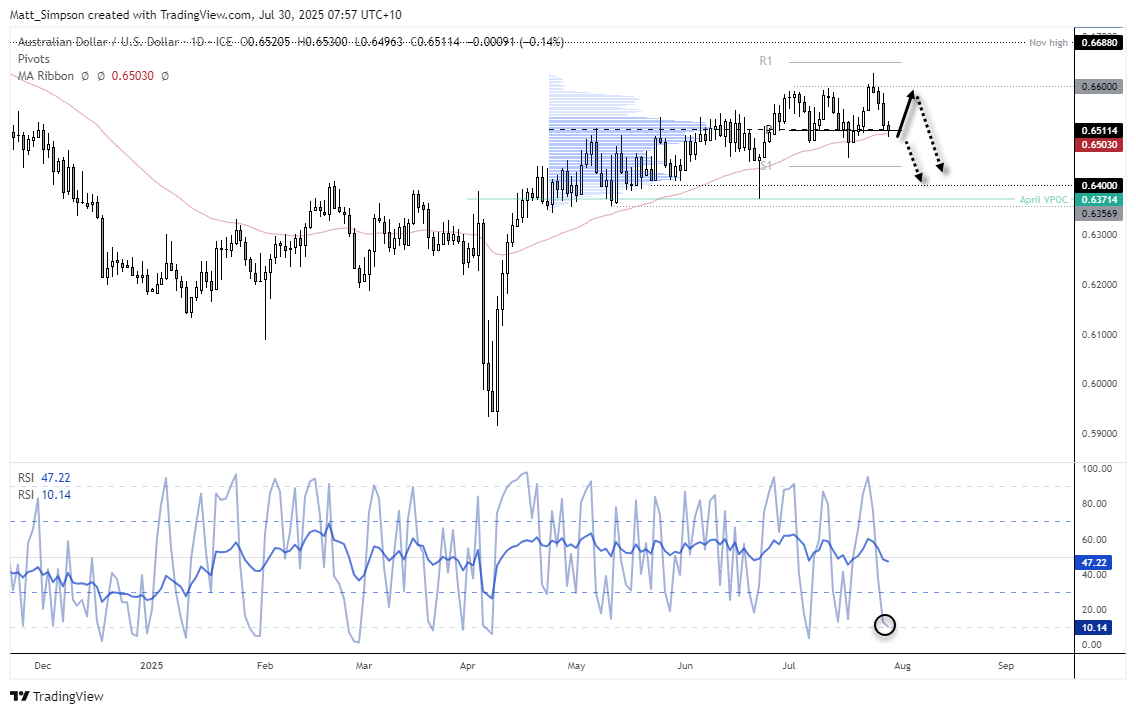
Chart analysis by Matt Simpson - data source: TradingView AUD/USD
View the full economic calendar
View the full economic calendar
-- Written by Matt Simpson
Follow Matt on Twitter @cLeverEdge
How to trade with City Index
You can trade with City Index by following these four easy steps:
- Open an account, or log in if you’re already a customer
• Open an account in the UK
• Open an account in Australia
• Open an account in Singapore
- Search for the market you want to trade in our award-winning platform
- Choose your position and size, and your stop and limit levels
- Place the trade
Related tags:


The complete CFD trading experience
Award-winning platforms, competitive spreads, low commissions and dedicated support.
We live and breathe the markets and are dedicated to helping traders realise their ambitions as we continue to set the industry bar.
Economic calendar
Web Trader platform
Our sophisticated web-based platform is packed with features.
Related articles
Euro Technical Forecast: EUR/USD Snaps Five-Week Slide at Critical Support 10 17 2026
Euro is attempting to regain its footing as stretched momentum raises the stakes for the next move ahead of key PMI data and central bank decisions.

USD/JPY Weekly Outlook: Volatility Has Left the Building
The yen has ignored broad dollar weakness, falling Treasury yields and renewed market turbulence. Yet its relationship with US interest rates remains intact. So why is USD/JPY going absolutely nowhere fast?


Swiss Franc Forecast: USD/CHF Seven-Week Rally Reverses From Yearly Highs 10 16 2026
A sharp rejection from fresh highs has shifted momentum in favor of USD/CHF bears, raising the stakes for a critical support test.
StoneX Europe Ltd may make third party material available on this website which may contain information included but not limited to the conditions of financial markets. The material is for information purposes only and does not contain, and should not be construed as containing, investment advice and/or investment recommendation and/or an investment research and/or an offer of or solicitation for any transactions in financial instruments; any decision to enter into a specific transaction shall be made by the client following an assessment by him/her of their situation.
StoneX Europe Ltd makes no representation or warranty and assumes no liability as to the accuracy or completeness of the information provided, nor any loss arising from any investment based on a recommendation, forecast or other information supplied. You should always seek independent advice as to your suitability to speculate in any related markets and your ability to assume the associated risks, if you are at all unsure. We are not under any obligation to update any such material. Any opinion made may be personal to the author and may not reflect the opinion of StoneX Europe Ltd.